Immigrants from Lebanon vs Chinese 8th Grade
COMPARE
Immigrants from Lebanon
Chinese
8th Grade
8th Grade Comparison
Immigrants from Lebanon
Chinese
95.4%
8TH GRADE
13.7/ 100
METRIC RATING
209th/ 347
METRIC RANK
96.9%
8TH GRADE
100.0/ 100
METRIC RATING
42nd/ 347
METRIC RANK
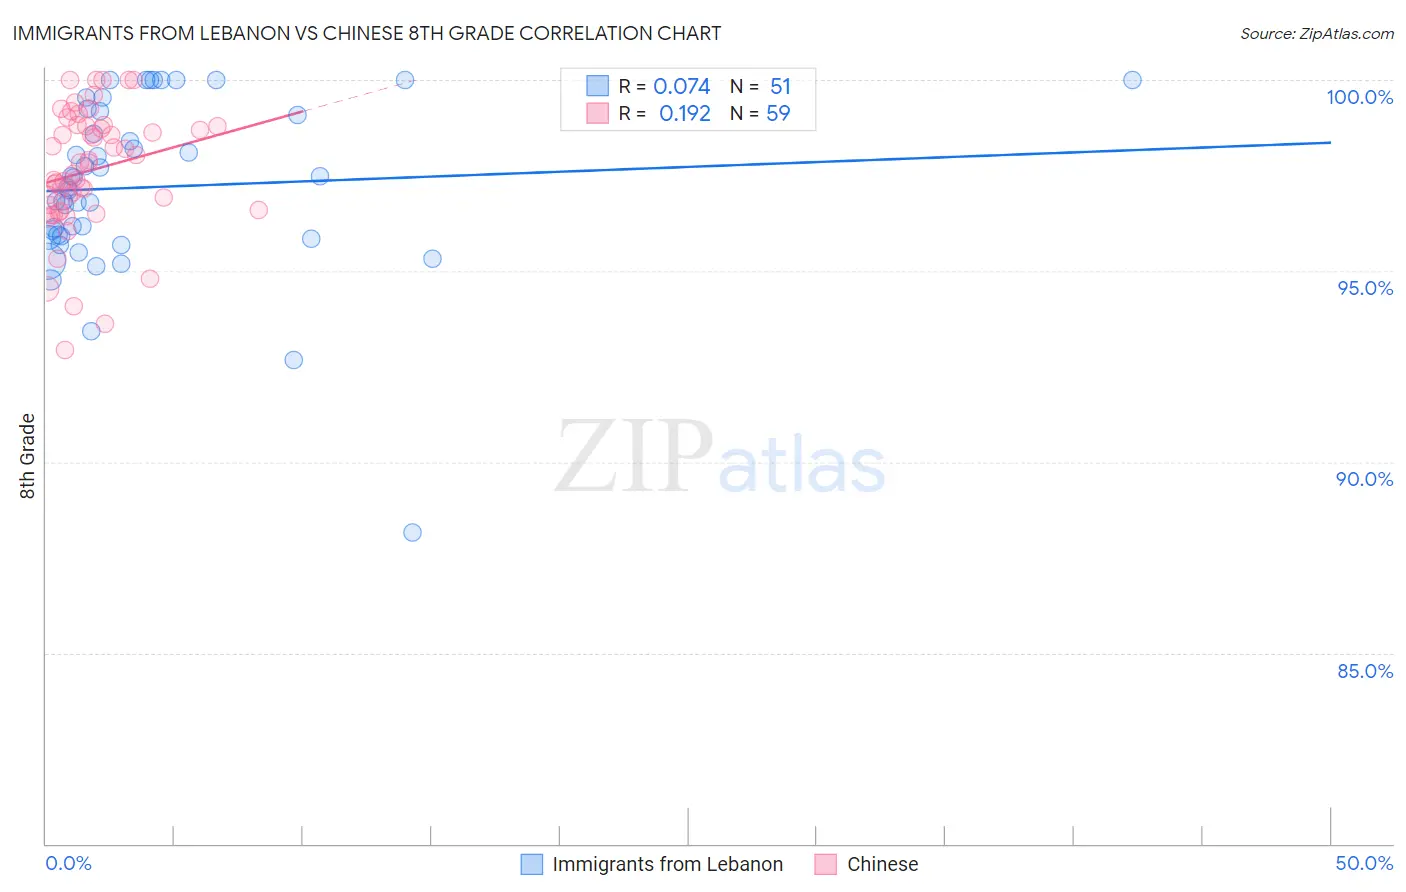
Immigrants from Lebanon vs Chinese 8th Grade Correlation Chart
The statistical analysis conducted on geographies consisting of 217,083,357 people shows a slight positive correlation between the proportion of Immigrants from Lebanon and percentage of population with at least 8th grade education in the United States with a correlation coefficient (R) of 0.074 and weighted average of 95.4%. Similarly, the statistical analysis conducted on geographies consisting of 64,809,883 people shows a poor positive correlation between the proportion of Chinese and percentage of population with at least 8th grade education in the United States with a correlation coefficient (R) of 0.192 and weighted average of 96.9%, a difference of 1.5%.
8th Grade Correlation Summary
| Measurement | Immigrants from Lebanon | Chinese |
| Minimum | 88.2% | 92.9% |
| Maximum | 100.0% | 100.0% |
| Range | 11.8% | 7.1% |
| Mean | 97.2% | 97.6% |
| Median | 97.2% | 97.8% |
| Interquartile 25% (IQ1) | 95.9% | 96.6% |
| Interquartile 75% (IQ3) | 99.2% | 98.8% |
| Interquartile Range (IQR) | 3.3% | 2.2% |
| Standard Deviation (Sample) | 2.3% | 1.6% |
| Standard Deviation (Population) | 2.3% | 1.6% |
Similar Demographics by 8th Grade
Demographics Similar to Immigrants from Lebanon by 8th Grade
In terms of 8th grade, the demographic groups most similar to Immigrants from Lebanon are African (95.4%, a difference of 0.0%), Portuguese (95.5%, a difference of 0.010%), Immigrants from Sudan (95.5%, a difference of 0.020%), Immigrants from Morocco (95.4%, a difference of 0.020%), and Comanche (95.5%, a difference of 0.030%).
| Demographics | Rating | Rank | 8th Grade |
| Apache | 19.4 /100 | #202 | Poor 95.5% |
| Moroccans | 17.4 /100 | #203 | Poor 95.5% |
| Hawaiians | 16.7 /100 | #204 | Poor 95.5% |
| Immigrants | Bahamas | 16.7 /100 | #205 | Poor 95.5% |
| Comanche | 16.3 /100 | #206 | Poor 95.5% |
| Immigrants | Sudan | 15.1 /100 | #207 | Poor 95.5% |
| Portuguese | 14.3 /100 | #208 | Poor 95.5% |
| Immigrants | Lebanon | 13.7 /100 | #209 | Poor 95.4% |
| Africans | 13.6 /100 | #210 | Poor 95.4% |
| Immigrants | Morocco | 12.4 /100 | #211 | Poor 95.4% |
| Immigrants | Pakistan | 9.7 /100 | #212 | Tragic 95.4% |
| Laotians | 9.0 /100 | #213 | Tragic 95.4% |
| Immigrants | Chile | 9.0 /100 | #214 | Tragic 95.4% |
| Immigrants | Liberia | 8.9 /100 | #215 | Tragic 95.4% |
| Samoans | 8.4 /100 | #216 | Tragic 95.4% |
Demographics Similar to Chinese by 8th Grade
In terms of 8th grade, the demographic groups most similar to Chinese are Aleut (96.9%, a difference of 0.030%), Inupiat (97.0%, a difference of 0.040%), Eastern European (97.0%, a difference of 0.040%), Maltese (96.9%, a difference of 0.050%), and Northern European (96.9%, a difference of 0.050%).
| Demographics | Rating | Rank | 8th Grade |
| Alaska Natives | 100.0 /100 | #35 | Exceptional 97.0% |
| Belgians | 100.0 /100 | #36 | Exceptional 97.0% |
| Latvians | 100.0 /100 | #37 | Exceptional 97.0% |
| British | 100.0 /100 | #38 | Exceptional 97.0% |
| Hungarians | 100.0 /100 | #39 | Exceptional 97.0% |
| Inupiat | 100.0 /100 | #40 | Exceptional 97.0% |
| Eastern Europeans | 100.0 /100 | #41 | Exceptional 97.0% |
| Chinese | 100.0 /100 | #42 | Exceptional 96.9% |
| Aleuts | 99.9 /100 | #43 | Exceptional 96.9% |
| Maltese | 99.9 /100 | #44 | Exceptional 96.9% |
| Northern Europeans | 99.9 /100 | #45 | Exceptional 96.9% |
| Czechoslovakians | 99.9 /100 | #46 | Exceptional 96.9% |
| Bulgarians | 99.9 /100 | #47 | Exceptional 96.9% |
| Slavs | 99.9 /100 | #48 | Exceptional 96.8% |
| Estonians | 99.9 /100 | #49 | Exceptional 96.8% |