Tongan vs Immigrants from Nepal Female Poverty
COMPARE
Tongan
Immigrants from Nepal
Female Poverty
Female Poverty Comparison
Tongans
Immigrants from Nepal
11.9%
FEMALE POVERTY
99.2/ 100
METRIC RATING
44th/ 347
METRIC RANK
13.3%
FEMALE POVERTY
62.7/ 100
METRIC RATING
160th/ 347
METRIC RANK
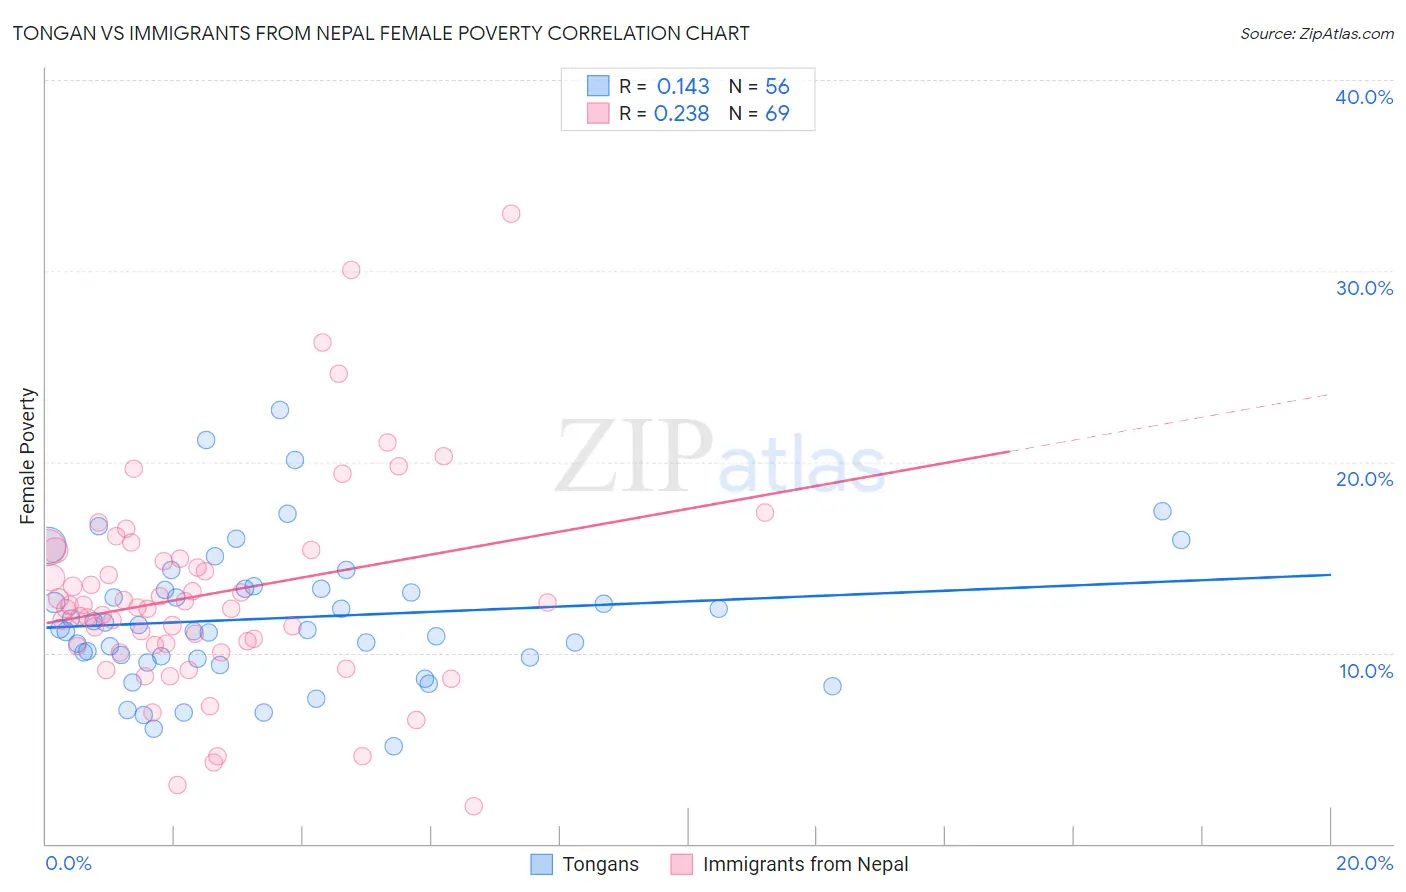
Tongan vs Immigrants from Nepal Female Poverty Correlation Chart
The statistical analysis conducted on geographies consisting of 102,866,719 people shows a poor positive correlation between the proportion of Tongans and poverty level among females in the United States with a correlation coefficient (R) of 0.143 and weighted average of 11.9%. Similarly, the statistical analysis conducted on geographies consisting of 186,688,907 people shows a weak positive correlation between the proportion of Immigrants from Nepal and poverty level among females in the United States with a correlation coefficient (R) of 0.238 and weighted average of 13.3%, a difference of 11.7%.
Female Poverty Correlation Summary
| Measurement | Tongan | Immigrants from Nepal |
| Minimum | 5.1% | 2.0% |
| Maximum | 22.7% | 33.0% |
| Range | 17.6% | 31.0% |
| Mean | 11.8% | 13.1% |
| Median | 11.2% | 12.4% |
| Interquartile 25% (IQ1) | 9.7% | 10.4% |
| Interquartile 75% (IQ3) | 13.3% | 15.2% |
| Interquartile Range (IQR) | 3.6% | 4.8% |
| Standard Deviation (Sample) | 3.6% | 5.5% |
| Standard Deviation (Population) | 3.6% | 5.5% |
Similar Demographics by Female Poverty
Demographics Similar to Tongans by Female Poverty
In terms of female poverty, the demographic groups most similar to Tongans are Korean (11.9%, a difference of 0.070%), Immigrants from Czechoslovakia (11.9%, a difference of 0.090%), Turkish (11.9%, a difference of 0.10%), Czech (11.9%, a difference of 0.11%), and Immigrants from Moldova (11.9%, a difference of 0.11%).
| Demographics | Rating | Rank | Female Poverty |
| Immigrants | Greece | 99.3 /100 | #37 | Exceptional 11.8% |
| Russians | 99.3 /100 | #38 | Exceptional 11.8% |
| Immigrants | Poland | 99.3 /100 | #39 | Exceptional 11.8% |
| Macedonians | 99.3 /100 | #40 | Exceptional 11.8% |
| Czechs | 99.2 /100 | #41 | Exceptional 11.9% |
| Immigrants | Moldova | 99.2 /100 | #42 | Exceptional 11.9% |
| Koreans | 99.2 /100 | #43 | Exceptional 11.9% |
| Tongans | 99.2 /100 | #44 | Exceptional 11.9% |
| Immigrants | Czechoslovakia | 99.2 /100 | #45 | Exceptional 11.9% |
| Turks | 99.2 /100 | #46 | Exceptional 11.9% |
| Asians | 99.1 /100 | #47 | Exceptional 11.9% |
| Immigrants | Japan | 99.0 /100 | #48 | Exceptional 11.9% |
| Immigrants | Romania | 99.0 /100 | #49 | Exceptional 12.0% |
| Slovenes | 98.9 /100 | #50 | Exceptional 12.0% |
| Immigrants | Bulgaria | 98.9 /100 | #51 | Exceptional 12.0% |
Demographics Similar to Immigrants from Nepal by Female Poverty
In terms of female poverty, the demographic groups most similar to Immigrants from Nepal are Immigrants from Ethiopia (13.3%, a difference of 0.030%), Guamanian/Chamorro (13.3%, a difference of 0.030%), Immigrants from Albania (13.3%, a difference of 0.040%), Ethiopian (13.3%, a difference of 0.050%), and Scotch-Irish (13.3%, a difference of 0.070%).
| Demographics | Rating | Rank | Female Poverty |
| Immigrants | Fiji | 71.0 /100 | #153 | Good 13.2% |
| Armenians | 70.4 /100 | #154 | Good 13.2% |
| Hungarians | 70.1 /100 | #155 | Good 13.2% |
| Immigrants | Bosnia and Herzegovina | 69.7 /100 | #156 | Good 13.2% |
| Immigrants | Northern Africa | 68.8 /100 | #157 | Good 13.2% |
| Pennsylvania Germans | 67.3 /100 | #158 | Good 13.2% |
| Costa Ricans | 63.6 /100 | #159 | Good 13.3% |
| Immigrants | Nepal | 62.7 /100 | #160 | Good 13.3% |
| Immigrants | Ethiopia | 62.5 /100 | #161 | Good 13.3% |
| Guamanians/Chamorros | 62.4 /100 | #162 | Good 13.3% |
| Immigrants | Albania | 62.4 /100 | #163 | Good 13.3% |
| Ethiopians | 62.3 /100 | #164 | Good 13.3% |
| Scotch-Irish | 62.1 /100 | #165 | Good 13.3% |
| Immigrants | Oceania | 59.7 /100 | #166 | Average 13.3% |
| Immigrants | Chile | 57.4 /100 | #167 | Average 13.3% |