Immigrants from Laos vs Palestinian Female Poverty
COMPARE
Immigrants from Laos
Palestinian
Female Poverty
Female Poverty Comparison
Immigrants from Laos
Palestinians
15.0%
FEMALE POVERTY
0.9/ 100
METRIC RATING
235th/ 347
METRIC RANK
12.5%
FEMALE POVERTY
94.3/ 100
METRIC RATING
104th/ 347
METRIC RANK
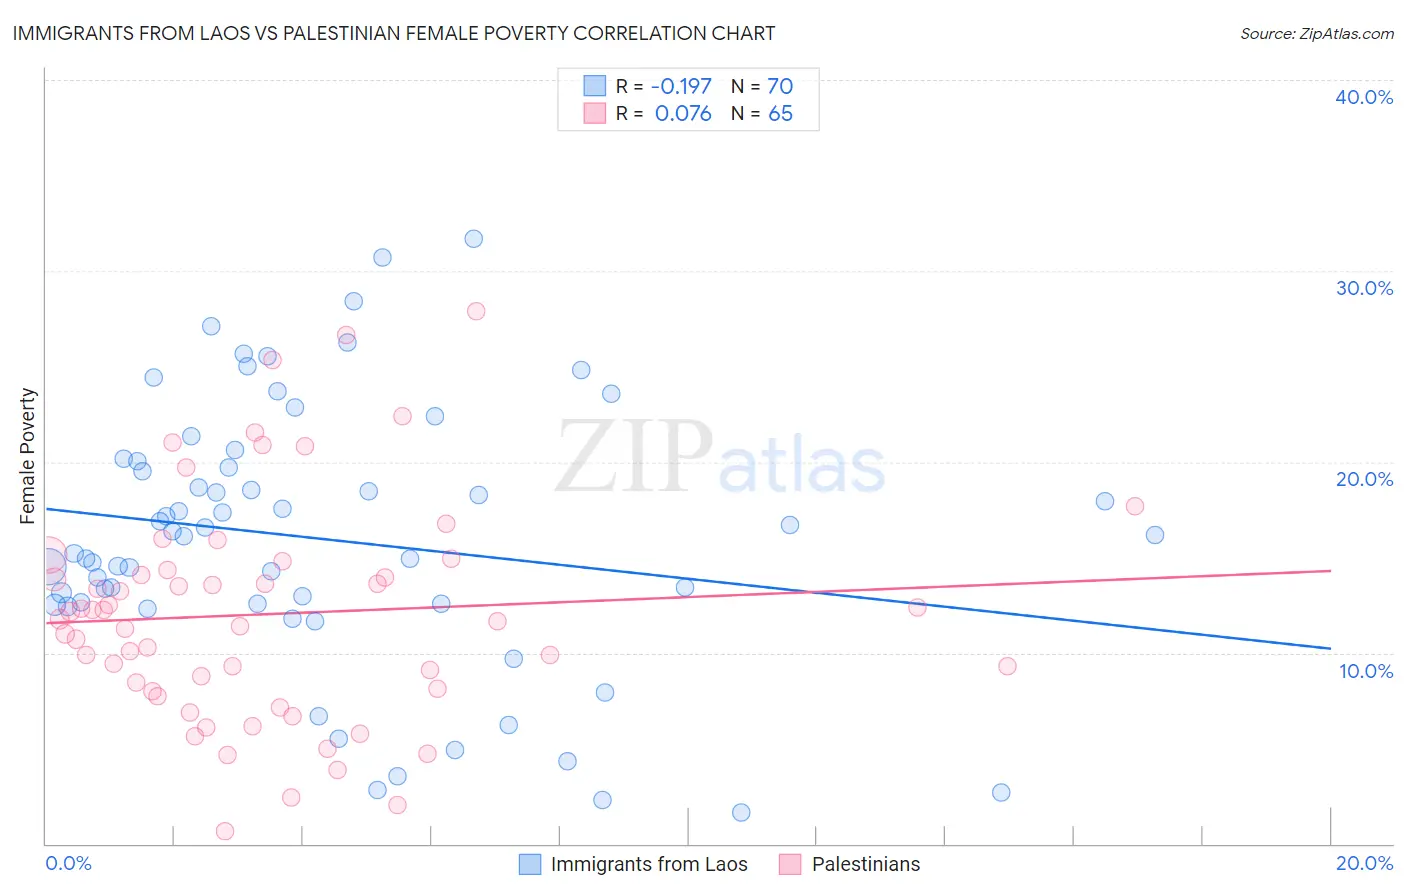
Immigrants from Laos vs Palestinian Female Poverty Correlation Chart
The statistical analysis conducted on geographies consisting of 201,464,148 people shows a poor negative correlation between the proportion of Immigrants from Laos and poverty level among females in the United States with a correlation coefficient (R) of -0.197 and weighted average of 15.0%. Similarly, the statistical analysis conducted on geographies consisting of 216,371,597 people shows a slight positive correlation between the proportion of Palestinians and poverty level among females in the United States with a correlation coefficient (R) of 0.076 and weighted average of 12.5%, a difference of 19.4%.
Female Poverty Correlation Summary
| Measurement | Immigrants from Laos | Palestinian |
| Minimum | 1.6% | 0.63% |
| Maximum | 31.7% | 27.9% |
| Range | 30.1% | 27.3% |
| Mean | 15.9% | 12.0% |
| Median | 16.1% | 11.8% |
| Interquartile 25% (IQ1) | 12.6% | 8.0% |
| Interquartile 75% (IQ3) | 20.1% | 14.6% |
| Interquartile Range (IQR) | 7.5% | 6.5% |
| Standard Deviation (Sample) | 7.0% | 5.8% |
| Standard Deviation (Population) | 6.9% | 5.8% |
Similar Demographics by Female Poverty
Demographics Similar to Immigrants from Laos by Female Poverty
In terms of female poverty, the demographic groups most similar to Immigrants from Laos are Fijian (14.9%, a difference of 0.44%), Cree (15.1%, a difference of 0.63%), French American Indian (15.1%, a difference of 0.82%), Immigrants from Armenia (15.1%, a difference of 0.90%), and Immigrants from Saudi Arabia (14.8%, a difference of 0.96%).
| Demographics | Rating | Rank | Female Poverty |
| German Russians | 2.0 /100 | #228 | Tragic 14.7% |
| Ghanaians | 1.9 /100 | #229 | Tragic 14.7% |
| Alaska Natives | 1.8 /100 | #230 | Tragic 14.7% |
| Nigerians | 1.7 /100 | #231 | Tragic 14.8% |
| Osage | 1.5 /100 | #232 | Tragic 14.8% |
| Immigrants | Saudi Arabia | 1.4 /100 | #233 | Tragic 14.8% |
| Fijians | 1.1 /100 | #234 | Tragic 14.9% |
| Immigrants | Laos | 0.9 /100 | #235 | Tragic 15.0% |
| Cree | 0.7 /100 | #236 | Tragic 15.1% |
| French American Indians | 0.6 /100 | #237 | Tragic 15.1% |
| Immigrants | Armenia | 0.6 /100 | #238 | Tragic 15.1% |
| Immigrants | Middle Africa | 0.5 /100 | #239 | Tragic 15.2% |
| Sudanese | 0.5 /100 | #240 | Tragic 15.2% |
| Immigrants | Sudan | 0.4 /100 | #241 | Tragic 15.2% |
| Nepalese | 0.4 /100 | #242 | Tragic 15.2% |
Demographics Similar to Palestinians by Female Poverty
In terms of female poverty, the demographic groups most similar to Palestinians are Slavic (12.5%, a difference of 0.090%), Immigrants from China (12.5%, a difference of 0.11%), Scottish (12.5%, a difference of 0.11%), Immigrants from Turkey (12.6%, a difference of 0.23%), and Immigrants from Latvia (12.5%, a difference of 0.26%).
| Demographics | Rating | Rank | Female Poverty |
| Australians | 95.2 /100 | #97 | Exceptional 12.5% |
| Native Hawaiians | 95.1 /100 | #98 | Exceptional 12.5% |
| Romanians | 95.1 /100 | #99 | Exceptional 12.5% |
| Immigrants | Latvia | 94.8 /100 | #100 | Exceptional 12.5% |
| Tlingit-Haida | 94.8 /100 | #101 | Exceptional 12.5% |
| Immigrants | China | 94.5 /100 | #102 | Exceptional 12.5% |
| Slavs | 94.5 /100 | #103 | Exceptional 12.5% |
| Palestinians | 94.3 /100 | #104 | Exceptional 12.5% |
| Scottish | 94.1 /100 | #105 | Exceptional 12.5% |
| Immigrants | Turkey | 93.8 /100 | #106 | Exceptional 12.6% |
| Laotians | 93.4 /100 | #107 | Exceptional 12.6% |
| Portuguese | 93.1 /100 | #108 | Exceptional 12.6% |
| Immigrants | Zimbabwe | 93.1 /100 | #109 | Exceptional 12.6% |
| Paraguayans | 93.0 /100 | #110 | Exceptional 12.6% |
| Soviet Union | 92.4 /100 | #111 | Exceptional 12.6% |