Immigrants from Asia vs Palestinian Female Poverty
COMPARE
Immigrants from Asia
Palestinian
Female Poverty
Female Poverty Comparison
Immigrants from Asia
Palestinians
12.2%
FEMALE POVERTY
98.1/ 100
METRIC RATING
61st/ 347
METRIC RANK
12.5%
FEMALE POVERTY
94.3/ 100
METRIC RATING
104th/ 347
METRIC RANK
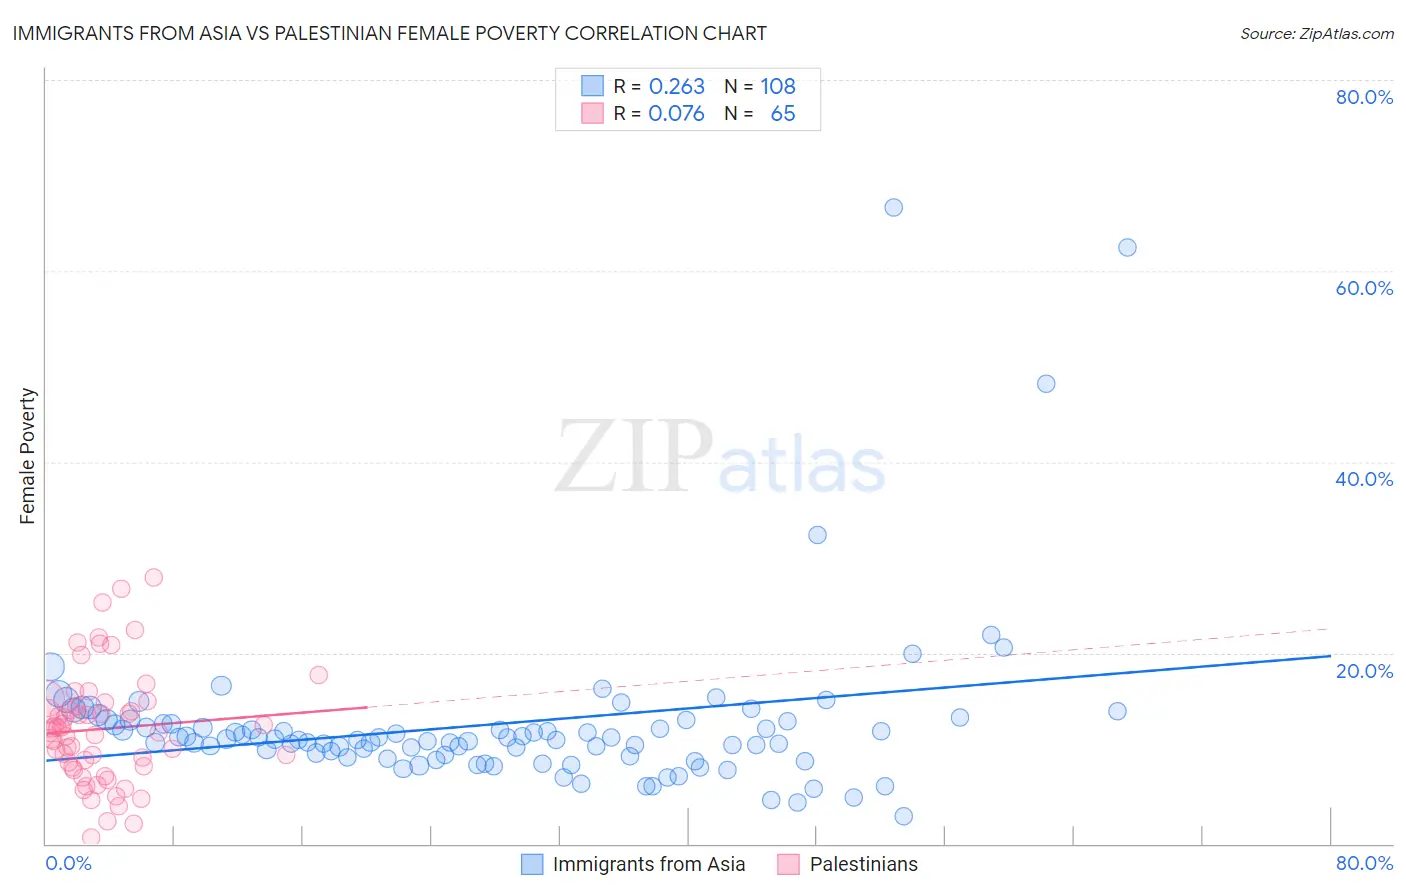
Immigrants from Asia vs Palestinian Female Poverty Correlation Chart
The statistical analysis conducted on geographies consisting of 548,172,468 people shows a weak positive correlation between the proportion of Immigrants from Asia and poverty level among females in the United States with a correlation coefficient (R) of 0.263 and weighted average of 12.2%. Similarly, the statistical analysis conducted on geographies consisting of 216,371,597 people shows a slight positive correlation between the proportion of Palestinians and poverty level among females in the United States with a correlation coefficient (R) of 0.076 and weighted average of 12.5%, a difference of 3.0%.
Female Poverty Correlation Summary
| Measurement | Immigrants from Asia | Palestinian |
| Minimum | 2.9% | 0.63% |
| Maximum | 66.7% | 27.9% |
| Range | 63.7% | 27.3% |
| Mean | 12.5% | 12.0% |
| Median | 10.9% | 11.8% |
| Interquartile 25% (IQ1) | 9.2% | 8.0% |
| Interquartile 75% (IQ3) | 12.7% | 14.6% |
| Interquartile Range (IQR) | 3.5% | 6.5% |
| Standard Deviation (Sample) | 8.9% | 5.8% |
| Standard Deviation (Population) | 8.8% | 5.8% |
Similar Demographics by Female Poverty
Demographics Similar to Immigrants from Asia by Female Poverty
In terms of female poverty, the demographic groups most similar to Immigrants from Asia are Immigrants from Australia (12.2%, a difference of 0.0%), Immigrants from Italy (12.2%, a difference of 0.020%), Ukrainian (12.2%, a difference of 0.10%), German (12.2%, a difference of 0.13%), and Indian (Asian) (12.2%, a difference of 0.16%).
| Demographics | Rating | Rank | Female Poverty |
| Immigrants | Philippines | 98.7 /100 | #54 | Exceptional 12.1% |
| Immigrants | Sri Lanka | 98.5 /100 | #55 | Exceptional 12.1% |
| Estonians | 98.3 /100 | #56 | Exceptional 12.1% |
| Immigrants | Serbia | 98.3 /100 | #57 | Exceptional 12.1% |
| Scandinavians | 98.2 /100 | #58 | Exceptional 12.1% |
| Immigrants | Europe | 98.2 /100 | #59 | Exceptional 12.1% |
| Immigrants | Australia | 98.1 /100 | #60 | Exceptional 12.2% |
| Immigrants | Asia | 98.1 /100 | #61 | Exceptional 12.2% |
| Immigrants | Italy | 98.0 /100 | #62 | Exceptional 12.2% |
| Ukrainians | 98.0 /100 | #63 | Exceptional 12.2% |
| Germans | 98.0 /100 | #64 | Exceptional 12.2% |
| Indians (Asian) | 97.9 /100 | #65 | Exceptional 12.2% |
| Austrians | 97.9 /100 | #66 | Exceptional 12.2% |
| Immigrants | Eastern Asia | 97.8 /100 | #67 | Exceptional 12.2% |
| Immigrants | Netherlands | 97.8 /100 | #68 | Exceptional 12.2% |
Demographics Similar to Palestinians by Female Poverty
In terms of female poverty, the demographic groups most similar to Palestinians are Slavic (12.5%, a difference of 0.090%), Immigrants from China (12.5%, a difference of 0.11%), Scottish (12.5%, a difference of 0.11%), Immigrants from Turkey (12.6%, a difference of 0.23%), and Immigrants from Latvia (12.5%, a difference of 0.26%).
| Demographics | Rating | Rank | Female Poverty |
| Australians | 95.2 /100 | #97 | Exceptional 12.5% |
| Native Hawaiians | 95.1 /100 | #98 | Exceptional 12.5% |
| Romanians | 95.1 /100 | #99 | Exceptional 12.5% |
| Immigrants | Latvia | 94.8 /100 | #100 | Exceptional 12.5% |
| Tlingit-Haida | 94.8 /100 | #101 | Exceptional 12.5% |
| Immigrants | China | 94.5 /100 | #102 | Exceptional 12.5% |
| Slavs | 94.5 /100 | #103 | Exceptional 12.5% |
| Palestinians | 94.3 /100 | #104 | Exceptional 12.5% |
| Scottish | 94.1 /100 | #105 | Exceptional 12.5% |
| Immigrants | Turkey | 93.8 /100 | #106 | Exceptional 12.6% |
| Laotians | 93.4 /100 | #107 | Exceptional 12.6% |
| Portuguese | 93.1 /100 | #108 | Exceptional 12.6% |
| Immigrants | Zimbabwe | 93.1 /100 | #109 | Exceptional 12.6% |
| Paraguayans | 93.0 /100 | #110 | Exceptional 12.6% |
| Soviet Union | 92.4 /100 | #111 | Exceptional 12.6% |