Croatian vs Palestinian Female Poverty
COMPARE
Croatian
Palestinian
Female Poverty
Female Poverty Comparison
Croatians
Palestinians
11.6%
FEMALE POVERTY
99.6/ 100
METRIC RATING
26th/ 347
METRIC RANK
12.5%
FEMALE POVERTY
94.3/ 100
METRIC RATING
104th/ 347
METRIC RANK
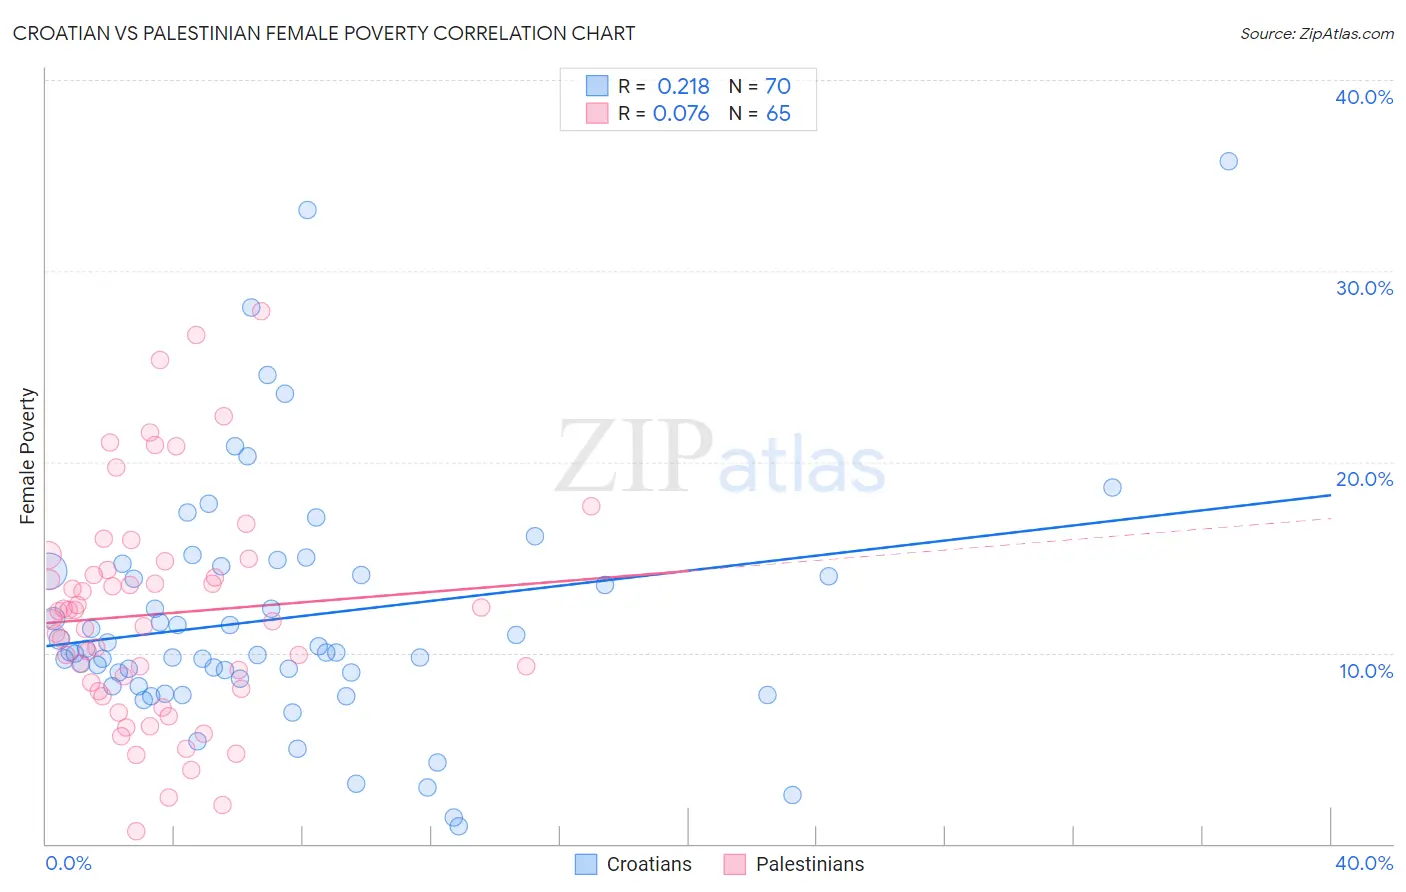
Croatian vs Palestinian Female Poverty Correlation Chart
The statistical analysis conducted on geographies consisting of 375,484,978 people shows a weak positive correlation between the proportion of Croatians and poverty level among females in the United States with a correlation coefficient (R) of 0.218 and weighted average of 11.6%. Similarly, the statistical analysis conducted on geographies consisting of 216,371,597 people shows a slight positive correlation between the proportion of Palestinians and poverty level among females in the United States with a correlation coefficient (R) of 0.076 and weighted average of 12.5%, a difference of 7.7%.
Female Poverty Correlation Summary
| Measurement | Croatian | Palestinian |
| Minimum | 0.92% | 0.63% |
| Maximum | 35.7% | 27.9% |
| Range | 34.8% | 27.3% |
| Mean | 11.8% | 12.0% |
| Median | 10.0% | 11.8% |
| Interquartile 25% (IQ1) | 8.6% | 8.0% |
| Interquartile 75% (IQ3) | 14.2% | 14.6% |
| Interquartile Range (IQR) | 5.6% | 6.5% |
| Standard Deviation (Sample) | 6.4% | 5.8% |
| Standard Deviation (Population) | 6.4% | 5.8% |
Similar Demographics by Female Poverty
Demographics Similar to Croatians by Female Poverty
In terms of female poverty, the demographic groups most similar to Croatians are Immigrants from Northern Europe (11.6%, a difference of 0.0%), Iranian (11.7%, a difference of 0.11%), Luxembourger (11.6%, a difference of 0.27%), Burmese (11.6%, a difference of 0.29%), and Immigrants from Korea (11.7%, a difference of 0.32%).
| Demographics | Rating | Rank | Female Poverty |
| Norwegians | 99.8 /100 | #19 | Exceptional 11.5% |
| Eastern Europeans | 99.7 /100 | #20 | Exceptional 11.5% |
| Italians | 99.7 /100 | #21 | Exceptional 11.6% |
| Swedes | 99.7 /100 | #22 | Exceptional 11.6% |
| Burmese | 99.7 /100 | #23 | Exceptional 11.6% |
| Luxembourgers | 99.7 /100 | #24 | Exceptional 11.6% |
| Immigrants | Northern Europe | 99.6 /100 | #25 | Exceptional 11.6% |
| Croatians | 99.6 /100 | #26 | Exceptional 11.6% |
| Iranians | 99.6 /100 | #27 | Exceptional 11.7% |
| Immigrants | Korea | 99.6 /100 | #28 | Exceptional 11.7% |
| Immigrants | North Macedonia | 99.6 /100 | #29 | Exceptional 11.7% |
| Greeks | 99.5 /100 | #30 | Exceptional 11.7% |
| Poles | 99.5 /100 | #31 | Exceptional 11.7% |
| Danes | 99.5 /100 | #32 | Exceptional 11.7% |
| Cypriots | 99.5 /100 | #33 | Exceptional 11.8% |
Demographics Similar to Palestinians by Female Poverty
In terms of female poverty, the demographic groups most similar to Palestinians are Slavic (12.5%, a difference of 0.090%), Immigrants from China (12.5%, a difference of 0.11%), Scottish (12.5%, a difference of 0.11%), Immigrants from Turkey (12.6%, a difference of 0.23%), and Immigrants from Latvia (12.5%, a difference of 0.26%).
| Demographics | Rating | Rank | Female Poverty |
| Australians | 95.2 /100 | #97 | Exceptional 12.5% |
| Native Hawaiians | 95.1 /100 | #98 | Exceptional 12.5% |
| Romanians | 95.1 /100 | #99 | Exceptional 12.5% |
| Immigrants | Latvia | 94.8 /100 | #100 | Exceptional 12.5% |
| Tlingit-Haida | 94.8 /100 | #101 | Exceptional 12.5% |
| Immigrants | China | 94.5 /100 | #102 | Exceptional 12.5% |
| Slavs | 94.5 /100 | #103 | Exceptional 12.5% |
| Palestinians | 94.3 /100 | #104 | Exceptional 12.5% |
| Scottish | 94.1 /100 | #105 | Exceptional 12.5% |
| Immigrants | Turkey | 93.8 /100 | #106 | Exceptional 12.6% |
| Laotians | 93.4 /100 | #107 | Exceptional 12.6% |
| Portuguese | 93.1 /100 | #108 | Exceptional 12.6% |
| Immigrants | Zimbabwe | 93.1 /100 | #109 | Exceptional 12.6% |
| Paraguayans | 93.0 /100 | #110 | Exceptional 12.6% |
| Soviet Union | 92.4 /100 | #111 | Exceptional 12.6% |