Immigrants from Laos vs Immigrants from the Azores Female Poverty
COMPARE
Immigrants from Laos
Immigrants from the Azores
Female Poverty
Female Poverty Comparison
Immigrants from Laos
Immigrants from the Azores
15.0%
FEMALE POVERTY
0.9/ 100
METRIC RATING
235th/ 347
METRIC RANK
14.2%
FEMALE POVERTY
7.9/ 100
METRIC RATING
208th/ 347
METRIC RANK
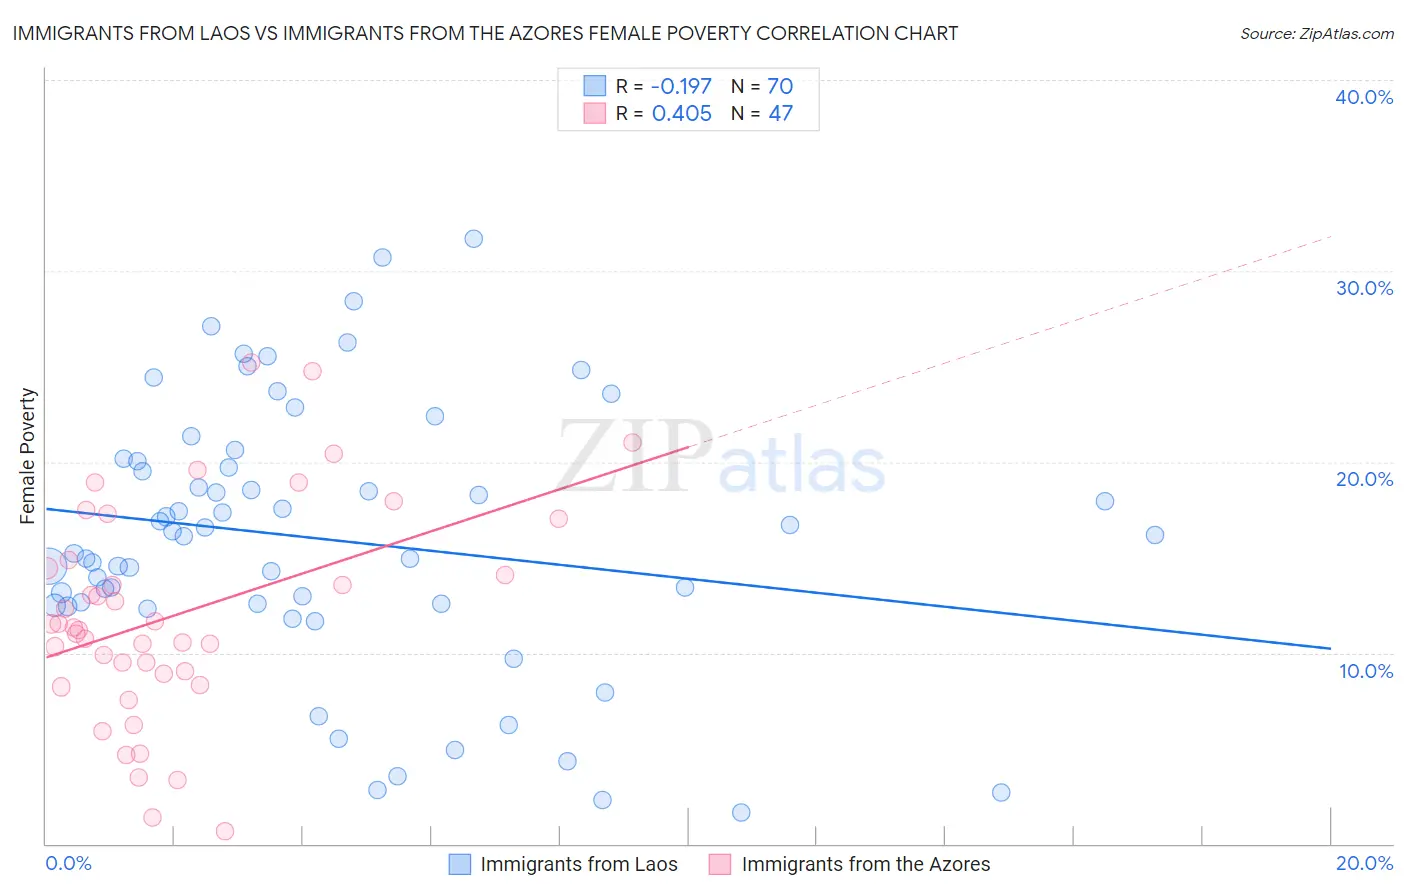
Immigrants from Laos vs Immigrants from the Azores Female Poverty Correlation Chart
The statistical analysis conducted on geographies consisting of 201,464,148 people shows a poor negative correlation between the proportion of Immigrants from Laos and poverty level among females in the United States with a correlation coefficient (R) of -0.197 and weighted average of 15.0%. Similarly, the statistical analysis conducted on geographies consisting of 46,244,959 people shows a moderate positive correlation between the proportion of Immigrants from the Azores and poverty level among females in the United States with a correlation coefficient (R) of 0.405 and weighted average of 14.2%, a difference of 5.1%.
Female Poverty Correlation Summary
| Measurement | Immigrants from Laos | Immigrants from the Azores |
| Minimum | 1.6% | 0.65% |
| Maximum | 31.7% | 25.2% |
| Range | 30.1% | 24.5% |
| Mean | 15.9% | 12.0% |
| Median | 16.1% | 11.3% |
| Interquartile 25% (IQ1) | 12.6% | 8.9% |
| Interquartile 75% (IQ3) | 20.1% | 14.8% |
| Interquartile Range (IQR) | 7.5% | 5.9% |
| Standard Deviation (Sample) | 7.0% | 5.6% |
| Standard Deviation (Population) | 6.9% | 5.6% |
Similar Demographics by Female Poverty
Demographics Similar to Immigrants from Laos by Female Poverty
In terms of female poverty, the demographic groups most similar to Immigrants from Laos are Fijian (14.9%, a difference of 0.44%), Cree (15.1%, a difference of 0.63%), French American Indian (15.1%, a difference of 0.82%), Immigrants from Armenia (15.1%, a difference of 0.90%), and Immigrants from Saudi Arabia (14.8%, a difference of 0.96%).
| Demographics | Rating | Rank | Female Poverty |
| German Russians | 2.0 /100 | #228 | Tragic 14.7% |
| Ghanaians | 1.9 /100 | #229 | Tragic 14.7% |
| Alaska Natives | 1.8 /100 | #230 | Tragic 14.7% |
| Nigerians | 1.7 /100 | #231 | Tragic 14.8% |
| Osage | 1.5 /100 | #232 | Tragic 14.8% |
| Immigrants | Saudi Arabia | 1.4 /100 | #233 | Tragic 14.8% |
| Fijians | 1.1 /100 | #234 | Tragic 14.9% |
| Immigrants | Laos | 0.9 /100 | #235 | Tragic 15.0% |
| Cree | 0.7 /100 | #236 | Tragic 15.1% |
| French American Indians | 0.6 /100 | #237 | Tragic 15.1% |
| Immigrants | Armenia | 0.6 /100 | #238 | Tragic 15.1% |
| Immigrants | Middle Africa | 0.5 /100 | #239 | Tragic 15.2% |
| Sudanese | 0.5 /100 | #240 | Tragic 15.2% |
| Immigrants | Sudan | 0.4 /100 | #241 | Tragic 15.2% |
| Nepalese | 0.4 /100 | #242 | Tragic 15.2% |
Demographics Similar to Immigrants from the Azores by Female Poverty
In terms of female poverty, the demographic groups most similar to Immigrants from the Azores are Panamanian (14.2%, a difference of 0.060%), Malaysian (14.3%, a difference of 0.15%), Moroccan (14.3%, a difference of 0.23%), Immigrants from Eastern Africa (14.2%, a difference of 0.34%), and Bermudan (14.4%, a difference of 0.86%).
| Demographics | Rating | Rank | Female Poverty |
| Immigrants | Kenya | 21.1 /100 | #201 | Fair 13.9% |
| Hmong | 21.1 /100 | #202 | Fair 13.9% |
| Immigrants | Western Asia | 20.7 /100 | #203 | Fair 13.9% |
| Spaniards | 18.9 /100 | #204 | Poor 13.9% |
| Ugandans | 15.4 /100 | #205 | Poor 14.0% |
| Immigrants | Uruguay | 14.0 /100 | #206 | Poor 14.0% |
| Immigrants | Eastern Africa | 9.0 /100 | #207 | Tragic 14.2% |
| Immigrants | Azores | 7.9 /100 | #208 | Tragic 14.2% |
| Panamanians | 7.7 /100 | #209 | Tragic 14.2% |
| Malaysians | 7.4 /100 | #210 | Tragic 14.3% |
| Moroccans | 7.2 /100 | #211 | Tragic 14.3% |
| Bermudans | 5.5 /100 | #212 | Tragic 14.4% |
| Alaskan Athabascans | 5.3 /100 | #213 | Tragic 14.4% |
| Marshallese | 5.0 /100 | #214 | Tragic 14.4% |
| Immigrants | Panama | 4.7 /100 | #215 | Tragic 14.4% |