Immigrants from the Azores vs Palestinian Female Poverty
COMPARE
Immigrants from the Azores
Palestinian
Female Poverty
Female Poverty Comparison
Immigrants from the Azores
Palestinians
14.2%
FEMALE POVERTY
7.9/ 100
METRIC RATING
208th/ 347
METRIC RANK
12.5%
FEMALE POVERTY
94.3/ 100
METRIC RATING
104th/ 347
METRIC RANK
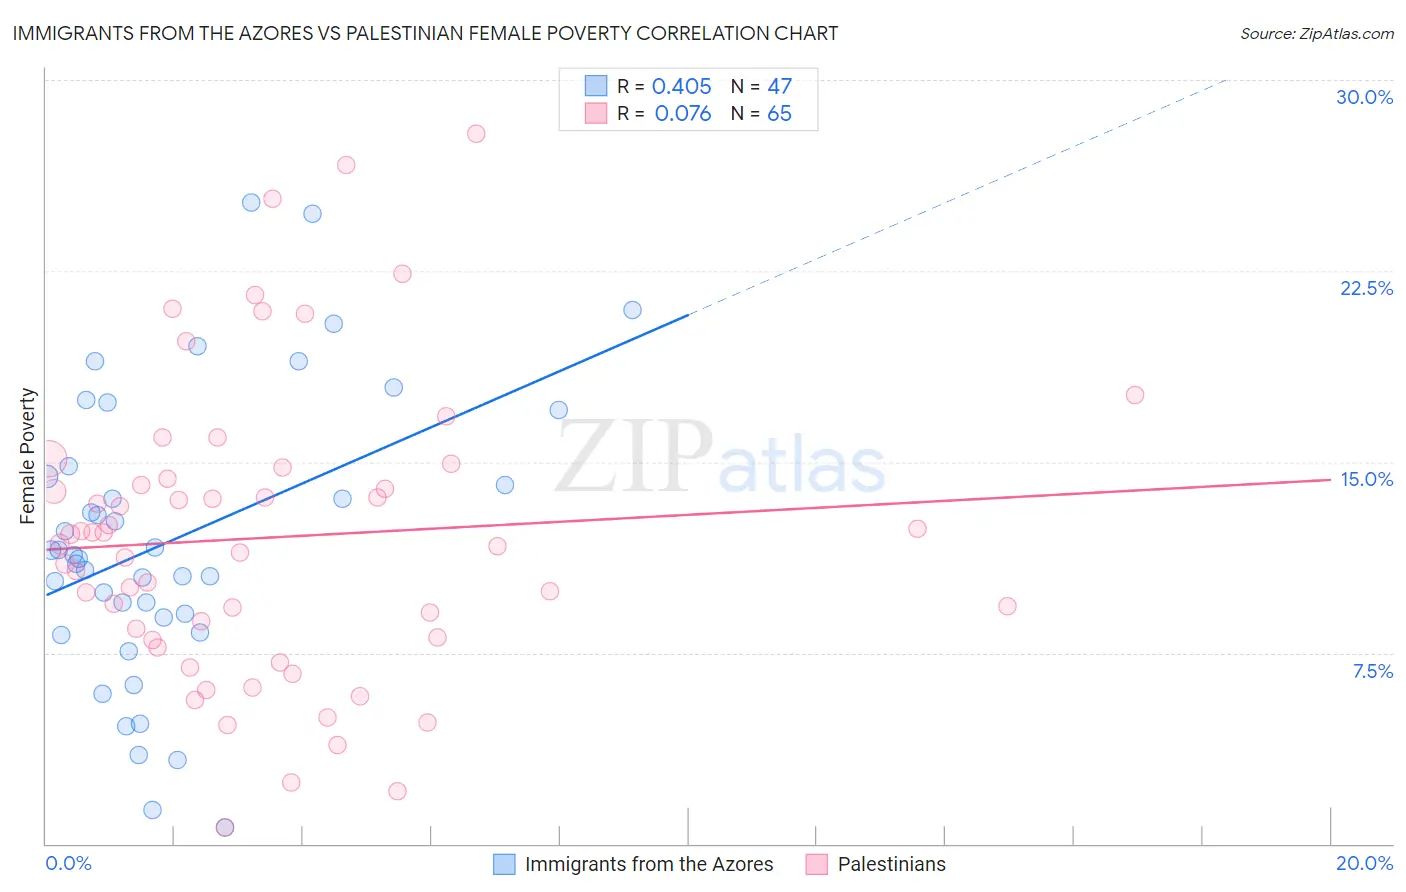
Immigrants from the Azores vs Palestinian Female Poverty Correlation Chart
The statistical analysis conducted on geographies consisting of 46,244,959 people shows a moderate positive correlation between the proportion of Immigrants from the Azores and poverty level among females in the United States with a correlation coefficient (R) of 0.405 and weighted average of 14.2%. Similarly, the statistical analysis conducted on geographies consisting of 216,371,597 people shows a slight positive correlation between the proportion of Palestinians and poverty level among females in the United States with a correlation coefficient (R) of 0.076 and weighted average of 12.5%, a difference of 13.6%.
Female Poverty Correlation Summary
| Measurement | Immigrants from the Azores | Palestinian |
| Minimum | 0.65% | 0.63% |
| Maximum | 25.2% | 27.9% |
| Range | 24.5% | 27.3% |
| Mean | 12.0% | 12.0% |
| Median | 11.3% | 11.8% |
| Interquartile 25% (IQ1) | 8.9% | 8.0% |
| Interquartile 75% (IQ3) | 14.8% | 14.6% |
| Interquartile Range (IQR) | 5.9% | 6.5% |
| Standard Deviation (Sample) | 5.6% | 5.8% |
| Standard Deviation (Population) | 5.6% | 5.8% |
Similar Demographics by Female Poverty
Demographics Similar to Immigrants from the Azores by Female Poverty
In terms of female poverty, the demographic groups most similar to Immigrants from the Azores are Panamanian (14.2%, a difference of 0.060%), Malaysian (14.3%, a difference of 0.15%), Moroccan (14.3%, a difference of 0.23%), Immigrants from Eastern Africa (14.2%, a difference of 0.34%), and Bermudan (14.4%, a difference of 0.86%).
| Demographics | Rating | Rank | Female Poverty |
| Immigrants | Kenya | 21.1 /100 | #201 | Fair 13.9% |
| Hmong | 21.1 /100 | #202 | Fair 13.9% |
| Immigrants | Western Asia | 20.7 /100 | #203 | Fair 13.9% |
| Spaniards | 18.9 /100 | #204 | Poor 13.9% |
| Ugandans | 15.4 /100 | #205 | Poor 14.0% |
| Immigrants | Uruguay | 14.0 /100 | #206 | Poor 14.0% |
| Immigrants | Eastern Africa | 9.0 /100 | #207 | Tragic 14.2% |
| Immigrants | Azores | 7.9 /100 | #208 | Tragic 14.2% |
| Panamanians | 7.7 /100 | #209 | Tragic 14.2% |
| Malaysians | 7.4 /100 | #210 | Tragic 14.3% |
| Moroccans | 7.2 /100 | #211 | Tragic 14.3% |
| Bermudans | 5.5 /100 | #212 | Tragic 14.4% |
| Alaskan Athabascans | 5.3 /100 | #213 | Tragic 14.4% |
| Marshallese | 5.0 /100 | #214 | Tragic 14.4% |
| Immigrants | Panama | 4.7 /100 | #215 | Tragic 14.4% |
Demographics Similar to Palestinians by Female Poverty
In terms of female poverty, the demographic groups most similar to Palestinians are Slavic (12.5%, a difference of 0.090%), Immigrants from China (12.5%, a difference of 0.11%), Scottish (12.5%, a difference of 0.11%), Immigrants from Turkey (12.6%, a difference of 0.23%), and Immigrants from Latvia (12.5%, a difference of 0.26%).
| Demographics | Rating | Rank | Female Poverty |
| Australians | 95.2 /100 | #97 | Exceptional 12.5% |
| Native Hawaiians | 95.1 /100 | #98 | Exceptional 12.5% |
| Romanians | 95.1 /100 | #99 | Exceptional 12.5% |
| Immigrants | Latvia | 94.8 /100 | #100 | Exceptional 12.5% |
| Tlingit-Haida | 94.8 /100 | #101 | Exceptional 12.5% |
| Immigrants | China | 94.5 /100 | #102 | Exceptional 12.5% |
| Slavs | 94.5 /100 | #103 | Exceptional 12.5% |
| Palestinians | 94.3 /100 | #104 | Exceptional 12.5% |
| Scottish | 94.1 /100 | #105 | Exceptional 12.5% |
| Immigrants | Turkey | 93.8 /100 | #106 | Exceptional 12.6% |
| Laotians | 93.4 /100 | #107 | Exceptional 12.6% |
| Portuguese | 93.1 /100 | #108 | Exceptional 12.6% |
| Immigrants | Zimbabwe | 93.1 /100 | #109 | Exceptional 12.6% |
| Paraguayans | 93.0 /100 | #110 | Exceptional 12.6% |
| Soviet Union | 92.4 /100 | #111 | Exceptional 12.6% |