Immigrants from Laos vs Palestinian Vision Disability
COMPARE
Immigrants from Laos
Palestinian
Vision Disability
Vision Disability Comparison
Immigrants from Laos
Palestinians
2.4%
VISION DISABILITY
0.4/ 100
METRIC RATING
251st/ 347
METRIC RANK
2.0%
VISION DISABILITY
98.3/ 100
METRIC RATING
74th/ 347
METRIC RANK
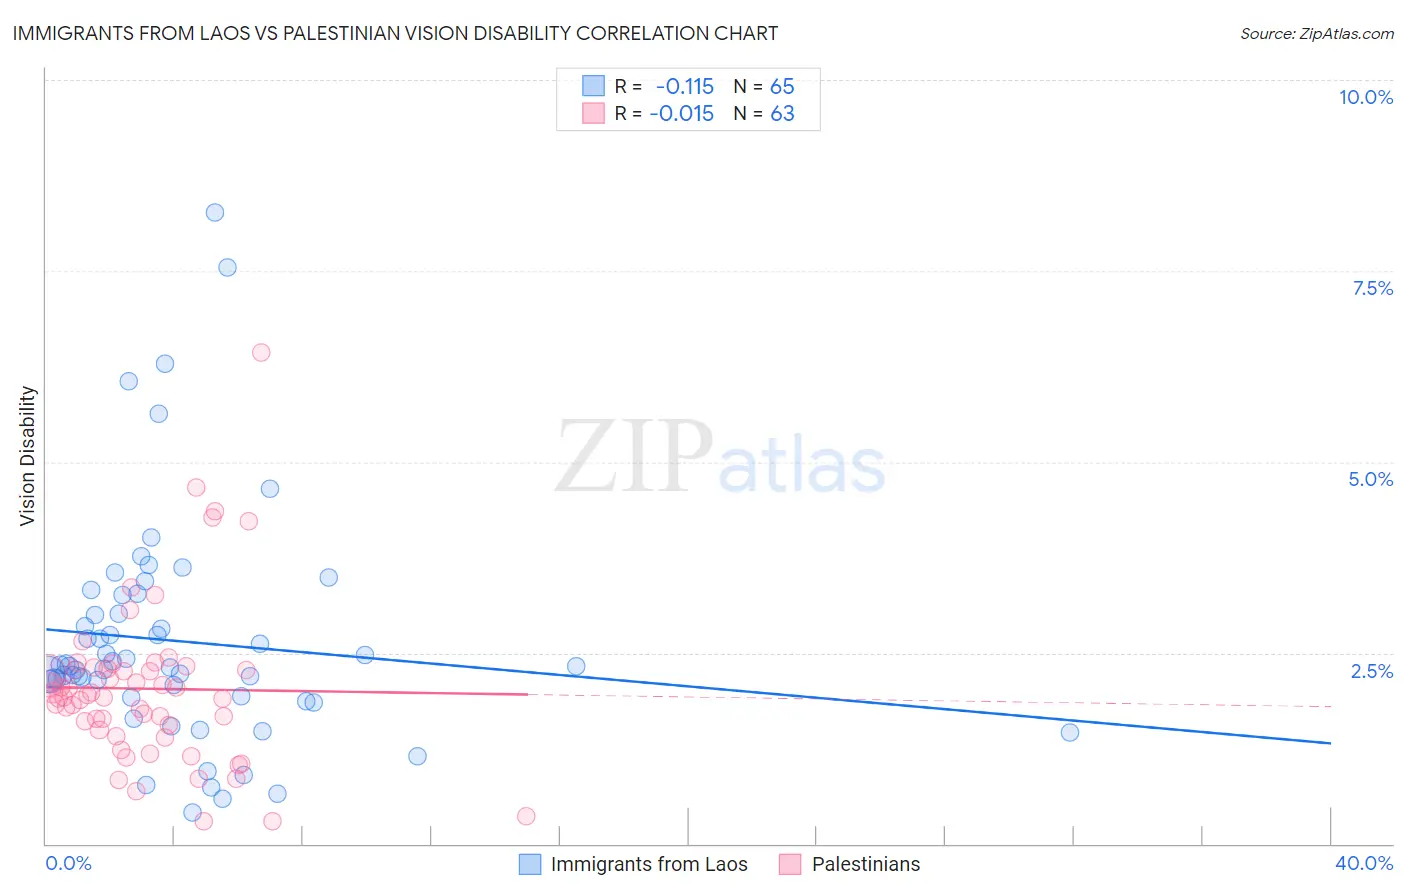
Immigrants from Laos vs Palestinian Vision Disability Correlation Chart
The statistical analysis conducted on geographies consisting of 201,435,761 people shows a poor negative correlation between the proportion of Immigrants from Laos and percentage of population with vision disability in the United States with a correlation coefficient (R) of -0.115 and weighted average of 2.4%. Similarly, the statistical analysis conducted on geographies consisting of 216,427,848 people shows no correlation between the proportion of Palestinians and percentage of population with vision disability in the United States with a correlation coefficient (R) of -0.015 and weighted average of 2.0%, a difference of 16.0%.
Vision Disability Correlation Summary
| Measurement | Immigrants from Laos | Palestinian |
| Minimum | 0.41% | 0.30% |
| Maximum | 8.3% | 6.4% |
| Range | 7.8% | 6.1% |
| Mean | 2.7% | 2.0% |
| Median | 2.3% | 1.9% |
| Interquartile 25% (IQ1) | 1.9% | 1.5% |
| Interquartile 75% (IQ3) | 3.1% | 2.3% |
| Interquartile Range (IQR) | 1.2% | 0.81% |
| Standard Deviation (Sample) | 1.5% | 1.1% |
| Standard Deviation (Population) | 1.5% | 1.1% |
Similar Demographics by Vision Disability
Demographics Similar to Immigrants from Laos by Vision Disability
In terms of vision disability, the demographic groups most similar to Immigrants from Laos are Bangladeshi (2.3%, a difference of 0.11%), Liberian (2.3%, a difference of 0.19%), Subsaharan African (2.3%, a difference of 0.21%), Guatemalan (2.3%, a difference of 0.23%), and French (2.3%, a difference of 0.27%).
| Demographics | Rating | Rank | Vision Disability |
| Immigrants | West Indies | 0.6 /100 | #244 | Tragic 2.3% |
| Alsatians | 0.6 /100 | #245 | Tragic 2.3% |
| French | 0.5 /100 | #246 | Tragic 2.3% |
| Guatemalans | 0.5 /100 | #247 | Tragic 2.3% |
| Sub-Saharan Africans | 0.5 /100 | #248 | Tragic 2.3% |
| Liberians | 0.5 /100 | #249 | Tragic 2.3% |
| Bangladeshis | 0.5 /100 | #250 | Tragic 2.3% |
| Immigrants | Laos | 0.4 /100 | #251 | Tragic 2.4% |
| Immigrants | Micronesia | 0.3 /100 | #252 | Tragic 2.4% |
| Japanese | 0.3 /100 | #253 | Tragic 2.4% |
| Haitians | 0.3 /100 | #254 | Tragic 2.4% |
| Immigrants | Guatemala | 0.3 /100 | #255 | Tragic 2.4% |
| Immigrants | Haiti | 0.2 /100 | #256 | Tragic 2.4% |
| West Indians | 0.2 /100 | #257 | Tragic 2.4% |
| British West Indians | 0.2 /100 | #258 | Tragic 2.4% |
Demographics Similar to Palestinians by Vision Disability
In terms of vision disability, the demographic groups most similar to Palestinians are Immigrants from North Macedonia (2.0%, a difference of 0.0%), Paraguayan (2.0%, a difference of 0.020%), Immigrants from Jordan (2.0%, a difference of 0.020%), Immigrants from Eritrea (2.0%, a difference of 0.050%), and Immigrants from Eastern Europe (2.0%, a difference of 0.050%).
| Demographics | Rating | Rank | Vision Disability |
| Immigrants | Northern Africa | 98.8 /100 | #67 | Exceptional 2.0% |
| Immigrants | Czechoslovakia | 98.7 /100 | #68 | Exceptional 2.0% |
| Russians | 98.6 /100 | #69 | Exceptional 2.0% |
| Immigrants | Kazakhstan | 98.6 /100 | #70 | Exceptional 2.0% |
| Immigrants | Northern Europe | 98.6 /100 | #71 | Exceptional 2.0% |
| Immigrants | France | 98.5 /100 | #72 | Exceptional 2.0% |
| Immigrants | Eritrea | 98.4 /100 | #73 | Exceptional 2.0% |
| Palestinians | 98.3 /100 | #74 | Exceptional 2.0% |
| Immigrants | North Macedonia | 98.3 /100 | #75 | Exceptional 2.0% |
| Paraguayans | 98.3 /100 | #76 | Exceptional 2.0% |
| Immigrants | Jordan | 98.3 /100 | #77 | Exceptional 2.0% |
| Immigrants | Eastern Europe | 98.3 /100 | #78 | Exceptional 2.0% |
| Assyrians/Chaldeans/Syriacs | 98.1 /100 | #79 | Exceptional 2.0% |
| Lithuanians | 97.7 /100 | #80 | Exceptional 2.0% |
| Soviet Union | 97.6 /100 | #81 | Exceptional 2.0% |