Immigrants from Laos vs Palestinian 9th Grade
COMPARE
Immigrants from Laos
Palestinian
9th Grade
9th Grade Comparison
Immigrants from Laos
Palestinians
93.2%
9TH GRADE
0.0/ 100
METRIC RATING
292nd/ 347
METRIC RANK
95.4%
9TH GRADE
94.3/ 100
METRIC RATING
127th/ 347
METRIC RANK
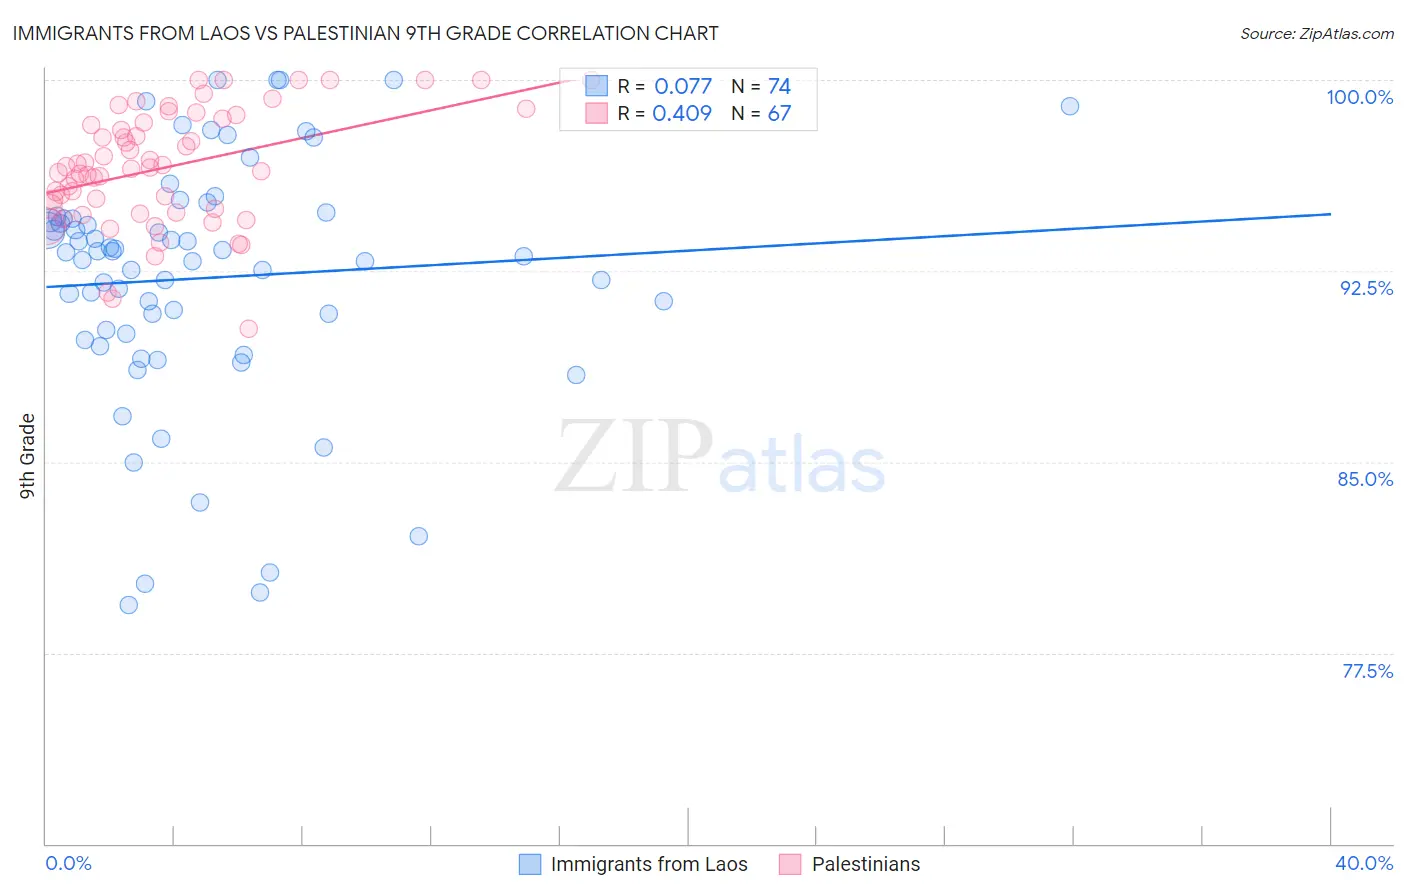
Immigrants from Laos vs Palestinian 9th Grade Correlation Chart
The statistical analysis conducted on geographies consisting of 201,472,886 people shows a slight positive correlation between the proportion of Immigrants from Laos and percentage of population with at least 9th grade education in the United States with a correlation coefficient (R) of 0.077 and weighted average of 93.2%. Similarly, the statistical analysis conducted on geographies consisting of 216,424,519 people shows a moderate positive correlation between the proportion of Palestinians and percentage of population with at least 9th grade education in the United States with a correlation coefficient (R) of 0.409 and weighted average of 95.4%, a difference of 2.3%.
9th Grade Correlation Summary
| Measurement | Immigrants from Laos | Palestinian |
| Minimum | 79.4% | 90.2% |
| Maximum | 100.0% | 100.0% |
| Range | 20.6% | 9.8% |
| Mean | 92.2% | 96.6% |
| Median | 93.1% | 96.6% |
| Interquartile 25% (IQ1) | 90.0% | 94.9% |
| Interquartile 75% (IQ3) | 94.6% | 98.5% |
| Interquartile Range (IQR) | 4.5% | 3.5% |
| Standard Deviation (Sample) | 4.8% | 2.3% |
| Standard Deviation (Population) | 4.8% | 2.3% |
Similar Demographics by 9th Grade
Demographics Similar to Immigrants from Laos by 9th Grade
In terms of 9th grade, the demographic groups most similar to Immigrants from Laos are Sri Lankan (93.2%, a difference of 0.010%), British West Indian (93.2%, a difference of 0.020%), Cuban (93.2%, a difference of 0.020%), Immigrants from Burma/Myanmar (93.1%, a difference of 0.040%), and Indonesian (93.1%, a difference of 0.040%).
| Demographics | Rating | Rank | 9th Grade |
| Immigrants | Peru | 0.0 /100 | #285 | Tragic 93.4% |
| Immigrants | Barbados | 0.0 /100 | #286 | Tragic 93.4% |
| Immigrants | St. Vincent and the Grenadines | 0.0 /100 | #287 | Tragic 93.4% |
| Immigrants | South Eastern Asia | 0.0 /100 | #288 | Tragic 93.3% |
| Immigrants | West Indies | 0.0 /100 | #289 | Tragic 93.3% |
| Pennsylvania Germans | 0.0 /100 | #290 | Tragic 93.3% |
| British West Indians | 0.0 /100 | #291 | Tragic 93.2% |
| Immigrants | Laos | 0.0 /100 | #292 | Tragic 93.2% |
| Sri Lankans | 0.0 /100 | #293 | Tragic 93.2% |
| Cubans | 0.0 /100 | #294 | Tragic 93.2% |
| Immigrants | Burma/Myanmar | 0.0 /100 | #295 | Tragic 93.1% |
| Indonesians | 0.0 /100 | #296 | Tragic 93.1% |
| Fijians | 0.0 /100 | #297 | Tragic 93.1% |
| Haitians | 0.0 /100 | #298 | Tragic 93.1% |
| Immigrants | Grenada | 0.0 /100 | #299 | Tragic 93.0% |
Demographics Similar to Palestinians by 9th Grade
In terms of 9th grade, the demographic groups most similar to Palestinians are Immigrants from Serbia (95.4%, a difference of 0.0%), Immigrants from Hungary (95.4%, a difference of 0.0%), Basque (95.4%, a difference of 0.010%), Jordanian (95.3%, a difference of 0.020%), and Immigrants from South Central Asia (95.4%, a difference of 0.030%).
| Demographics | Rating | Rank | 9th Grade |
| Cambodians | 95.6 /100 | #120 | Exceptional 95.4% |
| Cree | 95.5 /100 | #121 | Exceptional 95.4% |
| Immigrants | Kuwait | 95.5 /100 | #122 | Exceptional 95.4% |
| Kiowa | 95.3 /100 | #123 | Exceptional 95.4% |
| Shoshone | 95.3 /100 | #124 | Exceptional 95.4% |
| Immigrants | South Central Asia | 95.1 /100 | #125 | Exceptional 95.4% |
| Immigrants | Serbia | 94.4 /100 | #126 | Exceptional 95.4% |
| Palestinians | 94.3 /100 | #127 | Exceptional 95.4% |
| Immigrants | Hungary | 94.2 /100 | #128 | Exceptional 95.4% |
| Basques | 94.1 /100 | #129 | Exceptional 95.4% |
| Jordanians | 93.5 /100 | #130 | Exceptional 95.3% |
| Immigrants | North Macedonia | 92.3 /100 | #131 | Exceptional 95.3% |
| Immigrants | Nonimmigrants | 92.0 /100 | #132 | Exceptional 95.3% |
| Israelis | 90.4 /100 | #133 | Exceptional 95.3% |
| Immigrants | Israel | 89.6 /100 | #134 | Excellent 95.3% |