Immigrants from Korea vs Subsaharan African Poverty
COMPARE
Immigrants from Korea
Subsaharan African
Poverty
Poverty Comparison
Immigrants from Korea
Sub-Saharan Africans
10.7%
POVERTY
99.5/ 100
METRIC RATING
28th/ 347
METRIC RANK
14.5%
POVERTY
0.1/ 100
METRIC RATING
268th/ 347
METRIC RANK
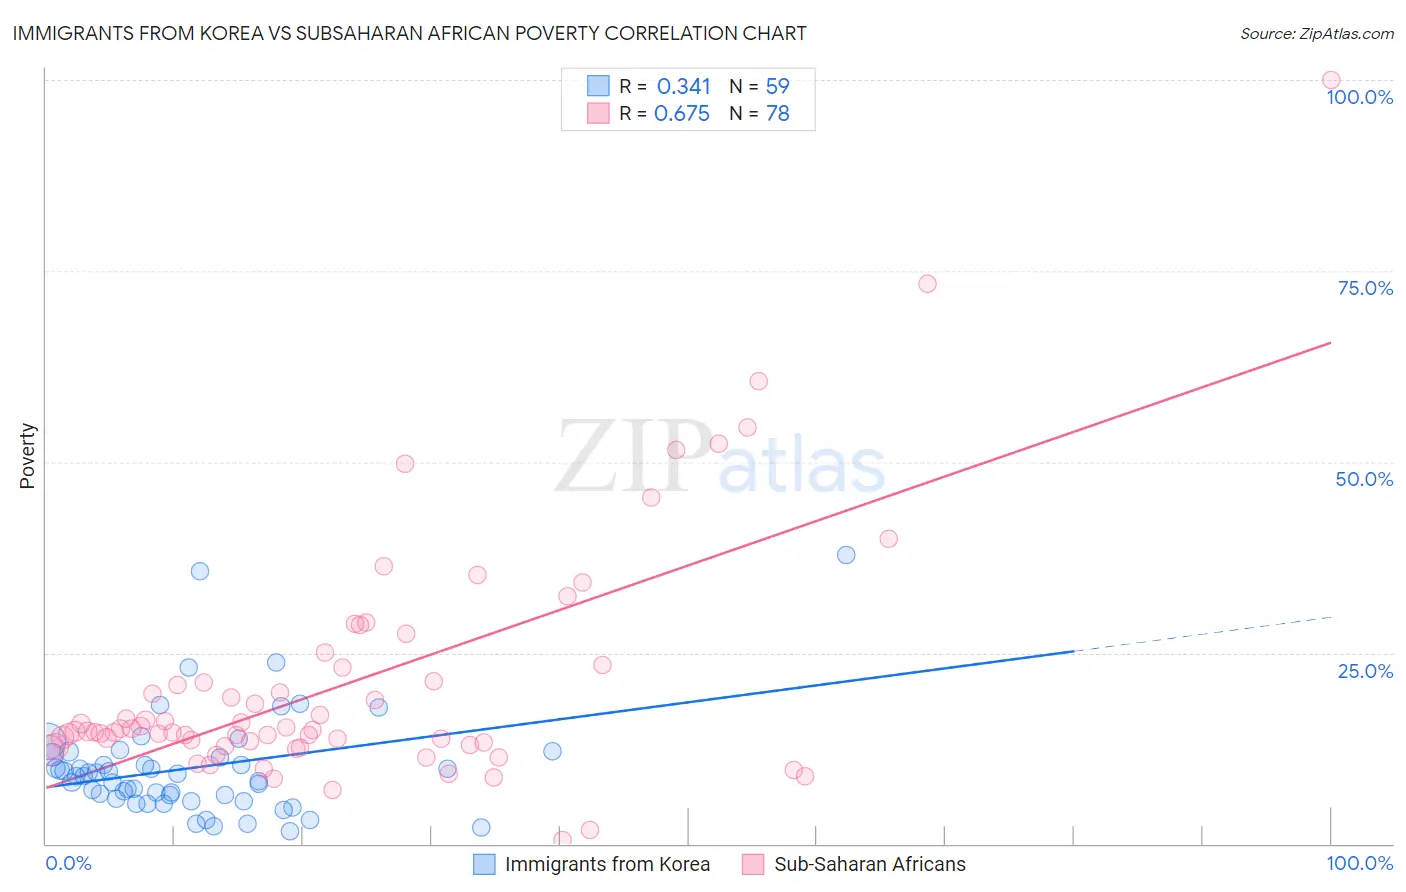
Immigrants from Korea vs Subsaharan African Poverty Correlation Chart
The statistical analysis conducted on geographies consisting of 415,974,452 people shows a mild positive correlation between the proportion of Immigrants from Korea and poverty level in the United States with a correlation coefficient (R) of 0.341 and weighted average of 10.7%. Similarly, the statistical analysis conducted on geographies consisting of 507,618,351 people shows a significant positive correlation between the proportion of Sub-Saharan Africans and poverty level in the United States with a correlation coefficient (R) of 0.675 and weighted average of 14.5%, a difference of 35.7%.
Poverty Correlation Summary
| Measurement | Immigrants from Korea | Subsaharan African |
| Minimum | 1.6% | 0.57% |
| Maximum | 37.7% | 100.0% |
| Range | 36.1% | 99.4% |
| Mean | 10.0% | 21.1% |
| Median | 8.9% | 14.9% |
| Interquartile 25% (IQ1) | 5.9% | 12.9% |
| Interquartile 75% (IQ3) | 11.7% | 23.1% |
| Interquartile Range (IQR) | 5.7% | 10.2% |
| Standard Deviation (Sample) | 7.0% | 16.2% |
| Standard Deviation (Population) | 6.9% | 16.1% |
Similar Demographics by Poverty
Demographics Similar to Immigrants from Korea by Poverty
In terms of poverty, the demographic groups most similar to Immigrants from Korea are Immigrants from Northern Europe (10.7%, a difference of 0.070%), Greek (10.7%, a difference of 0.090%), Danish (10.7%, a difference of 0.10%), Polish (10.7%, a difference of 0.19%), and Iranian (10.7%, a difference of 0.27%).
| Demographics | Rating | Rank | Poverty |
| Luxembourgers | 99.7 /100 | #21 | Exceptional 10.6% |
| Eastern Europeans | 99.7 /100 | #22 | Exceptional 10.6% |
| Swedes | 99.7 /100 | #23 | Exceptional 10.6% |
| Italians | 99.7 /100 | #24 | Exceptional 10.6% |
| Croatians | 99.6 /100 | #25 | Exceptional 10.6% |
| Burmese | 99.6 /100 | #26 | Exceptional 10.7% |
| Immigrants | Northern Europe | 99.6 /100 | #27 | Exceptional 10.7% |
| Immigrants | Korea | 99.5 /100 | #28 | Exceptional 10.7% |
| Greeks | 99.5 /100 | #29 | Exceptional 10.7% |
| Danes | 99.5 /100 | #30 | Exceptional 10.7% |
| Poles | 99.5 /100 | #31 | Exceptional 10.7% |
| Iranians | 99.5 /100 | #32 | Exceptional 10.7% |
| Macedonians | 99.4 /100 | #33 | Exceptional 10.8% |
| Immigrants | Poland | 99.4 /100 | #34 | Exceptional 10.8% |
| Tongans | 99.4 /100 | #35 | Exceptional 10.8% |
Demographics Similar to Sub-Saharan Africans by Poverty
In terms of poverty, the demographic groups most similar to Sub-Saharan Africans are Iroquois (14.5%, a difference of 0.040%), Immigrants from Cuba (14.6%, a difference of 0.15%), Central American (14.6%, a difference of 0.29%), Guyanese (14.5%, a difference of 0.35%), and Immigrants from Guyana (14.5%, a difference of 0.52%).
| Demographics | Rating | Rank | Poverty |
| Cherokee | 0.1 /100 | #261 | Tragic 14.4% |
| Immigrants | Liberia | 0.1 /100 | #262 | Tragic 14.4% |
| Jamaicans | 0.1 /100 | #263 | Tragic 14.4% |
| Immigrants | Jamaica | 0.1 /100 | #264 | Tragic 14.4% |
| Immigrants | Guyana | 0.1 /100 | #265 | Tragic 14.5% |
| Guyanese | 0.1 /100 | #266 | Tragic 14.5% |
| Iroquois | 0.1 /100 | #267 | Tragic 14.5% |
| Sub-Saharan Africans | 0.1 /100 | #268 | Tragic 14.5% |
| Immigrants | Cuba | 0.1 /100 | #269 | Tragic 14.6% |
| Central Americans | 0.1 /100 | #270 | Tragic 14.6% |
| Shoshone | 0.0 /100 | #271 | Tragic 14.7% |
| Chickasaw | 0.0 /100 | #272 | Tragic 14.7% |
| Spanish Americans | 0.0 /100 | #273 | Tragic 14.7% |
| Barbadians | 0.0 /100 | #274 | Tragic 14.8% |
| Immigrants | West Indies | 0.0 /100 | #275 | Tragic 14.8% |