Tongan vs Subsaharan African Poverty
COMPARE
Tongan
Subsaharan African
Poverty
Poverty Comparison
Tongans
Sub-Saharan Africans
10.8%
POVERTY
99.4/ 100
METRIC RATING
35th/ 347
METRIC RANK
14.5%
POVERTY
0.1/ 100
METRIC RATING
268th/ 347
METRIC RANK
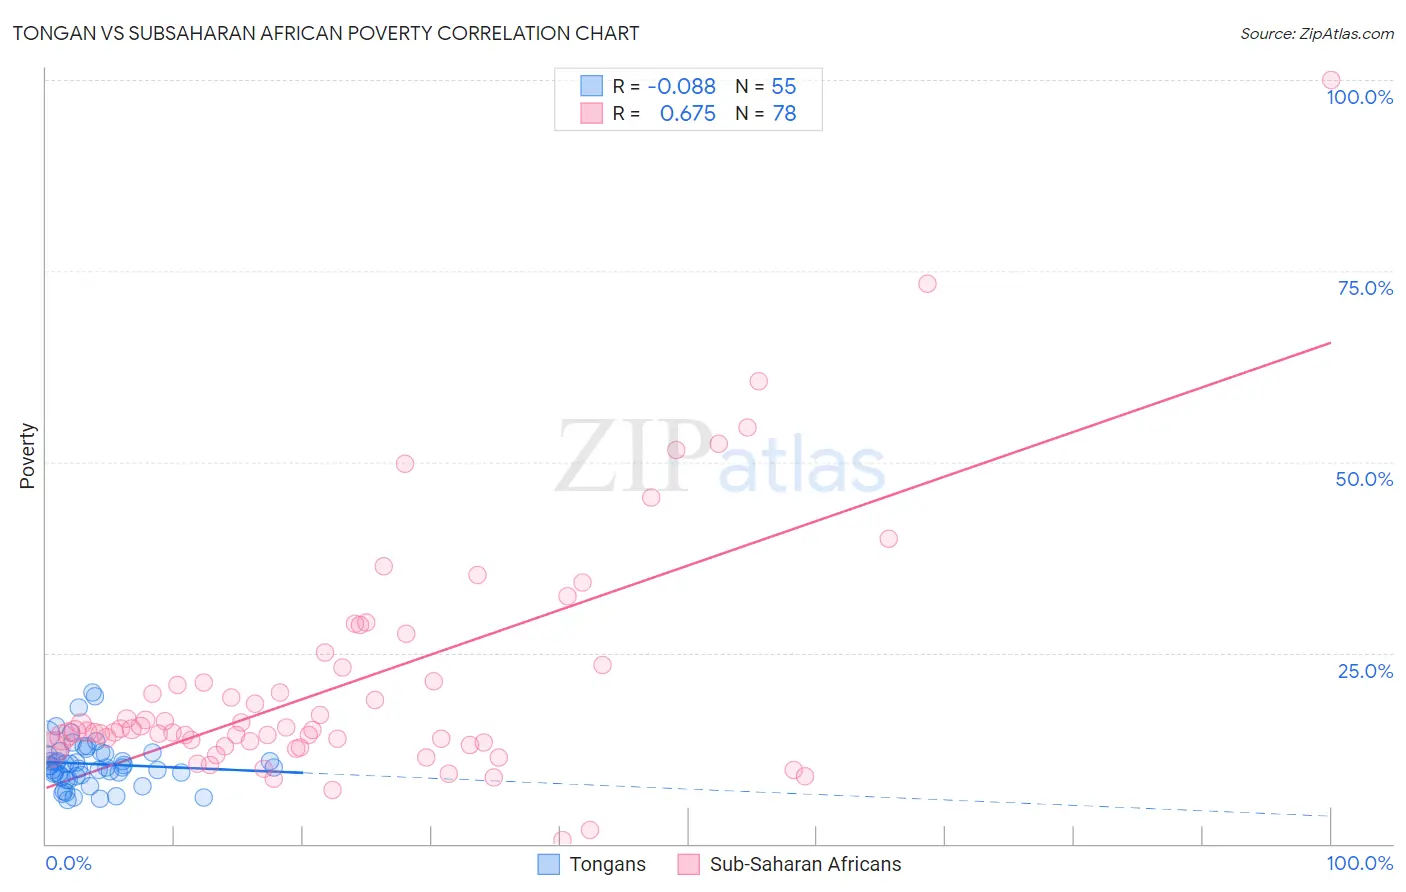
Tongan vs Subsaharan African Poverty Correlation Chart
The statistical analysis conducted on geographies consisting of 102,864,002 people shows a slight negative correlation between the proportion of Tongans and poverty level in the United States with a correlation coefficient (R) of -0.088 and weighted average of 10.8%. Similarly, the statistical analysis conducted on geographies consisting of 507,618,351 people shows a significant positive correlation between the proportion of Sub-Saharan Africans and poverty level in the United States with a correlation coefficient (R) of 0.675 and weighted average of 14.5%, a difference of 34.4%.
Poverty Correlation Summary
| Measurement | Tongan | Subsaharan African |
| Minimum | 5.8% | 0.57% |
| Maximum | 19.8% | 100.0% |
| Range | 14.1% | 99.4% |
| Mean | 10.4% | 21.1% |
| Median | 10.1% | 14.9% |
| Interquartile 25% (IQ1) | 8.8% | 12.9% |
| Interquartile 75% (IQ3) | 12.0% | 23.1% |
| Interquartile Range (IQR) | 3.1% | 10.2% |
| Standard Deviation (Sample) | 3.1% | 16.2% |
| Standard Deviation (Population) | 3.0% | 16.1% |
Similar Demographics by Poverty
Demographics Similar to Tongans by Poverty
In terms of poverty, the demographic groups most similar to Tongans are Immigrants from Poland (10.8%, a difference of 0.040%), Cypriot (10.8%, a difference of 0.080%), Macedonian (10.8%, a difference of 0.14%), Immigrants from Greece (10.8%, a difference of 0.17%), and Czech (10.8%, a difference of 0.22%).
| Demographics | Rating | Rank | Poverty |
| Immigrants | Korea | 99.5 /100 | #28 | Exceptional 10.7% |
| Greeks | 99.5 /100 | #29 | Exceptional 10.7% |
| Danes | 99.5 /100 | #30 | Exceptional 10.7% |
| Poles | 99.5 /100 | #31 | Exceptional 10.7% |
| Iranians | 99.5 /100 | #32 | Exceptional 10.7% |
| Macedonians | 99.4 /100 | #33 | Exceptional 10.8% |
| Immigrants | Poland | 99.4 /100 | #34 | Exceptional 10.8% |
| Tongans | 99.4 /100 | #35 | Exceptional 10.8% |
| Cypriots | 99.3 /100 | #36 | Exceptional 10.8% |
| Immigrants | Greece | 99.3 /100 | #37 | Exceptional 10.8% |
| Czechs | 99.3 /100 | #38 | Exceptional 10.8% |
| Immigrants | Pakistan | 99.3 /100 | #39 | Exceptional 10.8% |
| Russians | 99.3 /100 | #40 | Exceptional 10.9% |
| Immigrants | Iran | 99.2 /100 | #41 | Exceptional 10.9% |
| Koreans | 99.2 /100 | #42 | Exceptional 10.9% |
Demographics Similar to Sub-Saharan Africans by Poverty
In terms of poverty, the demographic groups most similar to Sub-Saharan Africans are Iroquois (14.5%, a difference of 0.040%), Immigrants from Cuba (14.6%, a difference of 0.15%), Central American (14.6%, a difference of 0.29%), Guyanese (14.5%, a difference of 0.35%), and Immigrants from Guyana (14.5%, a difference of 0.52%).
| Demographics | Rating | Rank | Poverty |
| Cherokee | 0.1 /100 | #261 | Tragic 14.4% |
| Immigrants | Liberia | 0.1 /100 | #262 | Tragic 14.4% |
| Jamaicans | 0.1 /100 | #263 | Tragic 14.4% |
| Immigrants | Jamaica | 0.1 /100 | #264 | Tragic 14.4% |
| Immigrants | Guyana | 0.1 /100 | #265 | Tragic 14.5% |
| Guyanese | 0.1 /100 | #266 | Tragic 14.5% |
| Iroquois | 0.1 /100 | #267 | Tragic 14.5% |
| Sub-Saharan Africans | 0.1 /100 | #268 | Tragic 14.5% |
| Immigrants | Cuba | 0.1 /100 | #269 | Tragic 14.6% |
| Central Americans | 0.1 /100 | #270 | Tragic 14.6% |
| Shoshone | 0.0 /100 | #271 | Tragic 14.7% |
| Chickasaw | 0.0 /100 | #272 | Tragic 14.7% |
| Spanish Americans | 0.0 /100 | #273 | Tragic 14.7% |
| Barbadians | 0.0 /100 | #274 | Tragic 14.8% |
| Immigrants | West Indies | 0.0 /100 | #275 | Tragic 14.8% |