Immigrants from Korea vs Lithuanian Poverty
COMPARE
Immigrants from Korea
Lithuanian
Poverty
Poverty Comparison
Immigrants from Korea
Lithuanians
10.7%
POVERTY
99.5/ 100
METRIC RATING
28th/ 347
METRIC RANK
10.5%
POVERTY
99.8/ 100
METRIC RATING
16th/ 347
METRIC RANK
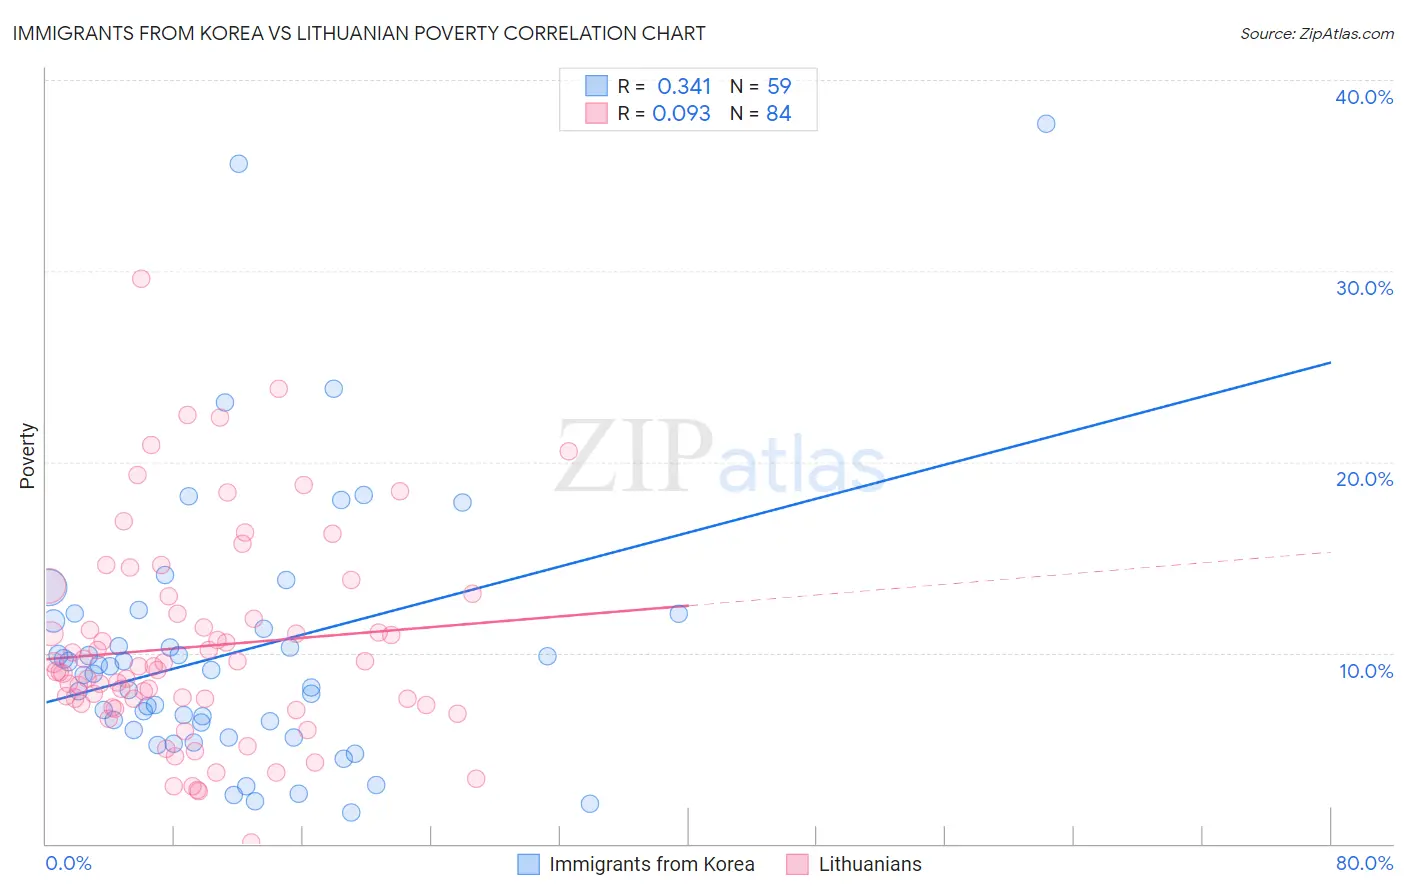
Immigrants from Korea vs Lithuanian Poverty Correlation Chart
The statistical analysis conducted on geographies consisting of 415,974,452 people shows a mild positive correlation between the proportion of Immigrants from Korea and poverty level in the United States with a correlation coefficient (R) of 0.341 and weighted average of 10.7%. Similarly, the statistical analysis conducted on geographies consisting of 421,719,572 people shows a slight positive correlation between the proportion of Lithuanians and poverty level in the United States with a correlation coefficient (R) of 0.093 and weighted average of 10.5%, a difference of 2.3%.
Poverty Correlation Summary
| Measurement | Immigrants from Korea | Lithuanian |
| Minimum | 1.6% | 0.071% |
| Maximum | 37.7% | 29.6% |
| Range | 36.1% | 29.5% |
| Mean | 10.0% | 10.3% |
| Median | 8.9% | 9.2% |
| Interquartile 25% (IQ1) | 5.9% | 7.3% |
| Interquartile 75% (IQ3) | 11.7% | 12.5% |
| Interquartile Range (IQR) | 5.7% | 5.2% |
| Standard Deviation (Sample) | 7.0% | 5.4% |
| Standard Deviation (Population) | 6.9% | 5.4% |
Demographics Similar to Immigrants from Korea and Lithuanians by Poverty
In terms of poverty, the demographic groups most similar to Immigrants from Korea are Immigrants from Northern Europe (10.7%, a difference of 0.070%), Greek (10.7%, a difference of 0.090%), Danish (10.7%, a difference of 0.10%), Polish (10.7%, a difference of 0.19%), and Iranian (10.7%, a difference of 0.27%). Similarly, the demographic groups most similar to Lithuanians are Bolivian (10.4%, a difference of 0.30%), Immigrants from Bolivia (10.4%, a difference of 0.31%), Norwegian (10.5%, a difference of 0.37%), Latvian (10.5%, a difference of 0.46%), and Immigrants from Hong Kong (10.4%, a difference of 0.62%).
| Demographics | Rating | Rank | Poverty |
| Bhutanese | 99.8 /100 | #12 | Exceptional 10.4% |
| Immigrants | Hong Kong | 99.8 /100 | #13 | Exceptional 10.4% |
| Immigrants | Bolivia | 99.8 /100 | #14 | Exceptional 10.4% |
| Bolivians | 99.8 /100 | #15 | Exceptional 10.4% |
| Lithuanians | 99.8 /100 | #16 | Exceptional 10.5% |
| Norwegians | 99.8 /100 | #17 | Exceptional 10.5% |
| Latvians | 99.8 /100 | #18 | Exceptional 10.5% |
| Immigrants | Scotland | 99.7 /100 | #19 | Exceptional 10.6% |
| Immigrants | North Macedonia | 99.7 /100 | #20 | Exceptional 10.6% |
| Luxembourgers | 99.7 /100 | #21 | Exceptional 10.6% |
| Eastern Europeans | 99.7 /100 | #22 | Exceptional 10.6% |
| Swedes | 99.7 /100 | #23 | Exceptional 10.6% |
| Italians | 99.7 /100 | #24 | Exceptional 10.6% |
| Croatians | 99.6 /100 | #25 | Exceptional 10.6% |
| Burmese | 99.6 /100 | #26 | Exceptional 10.7% |
| Immigrants | Northern Europe | 99.6 /100 | #27 | Exceptional 10.7% |
| Immigrants | Korea | 99.5 /100 | #28 | Exceptional 10.7% |
| Greeks | 99.5 /100 | #29 | Exceptional 10.7% |
| Danes | 99.5 /100 | #30 | Exceptional 10.7% |
| Poles | 99.5 /100 | #31 | Exceptional 10.7% |
| Iranians | 99.5 /100 | #32 | Exceptional 10.7% |