Immigrants from Hungary vs Subsaharan African Poverty
COMPARE
Immigrants from Hungary
Subsaharan African
Poverty
Poverty Comparison
Immigrants from Hungary
Sub-Saharan Africans
11.7%
POVERTY
88.6/ 100
METRIC RATING
123rd/ 347
METRIC RANK
14.5%
POVERTY
0.1/ 100
METRIC RATING
268th/ 347
METRIC RANK
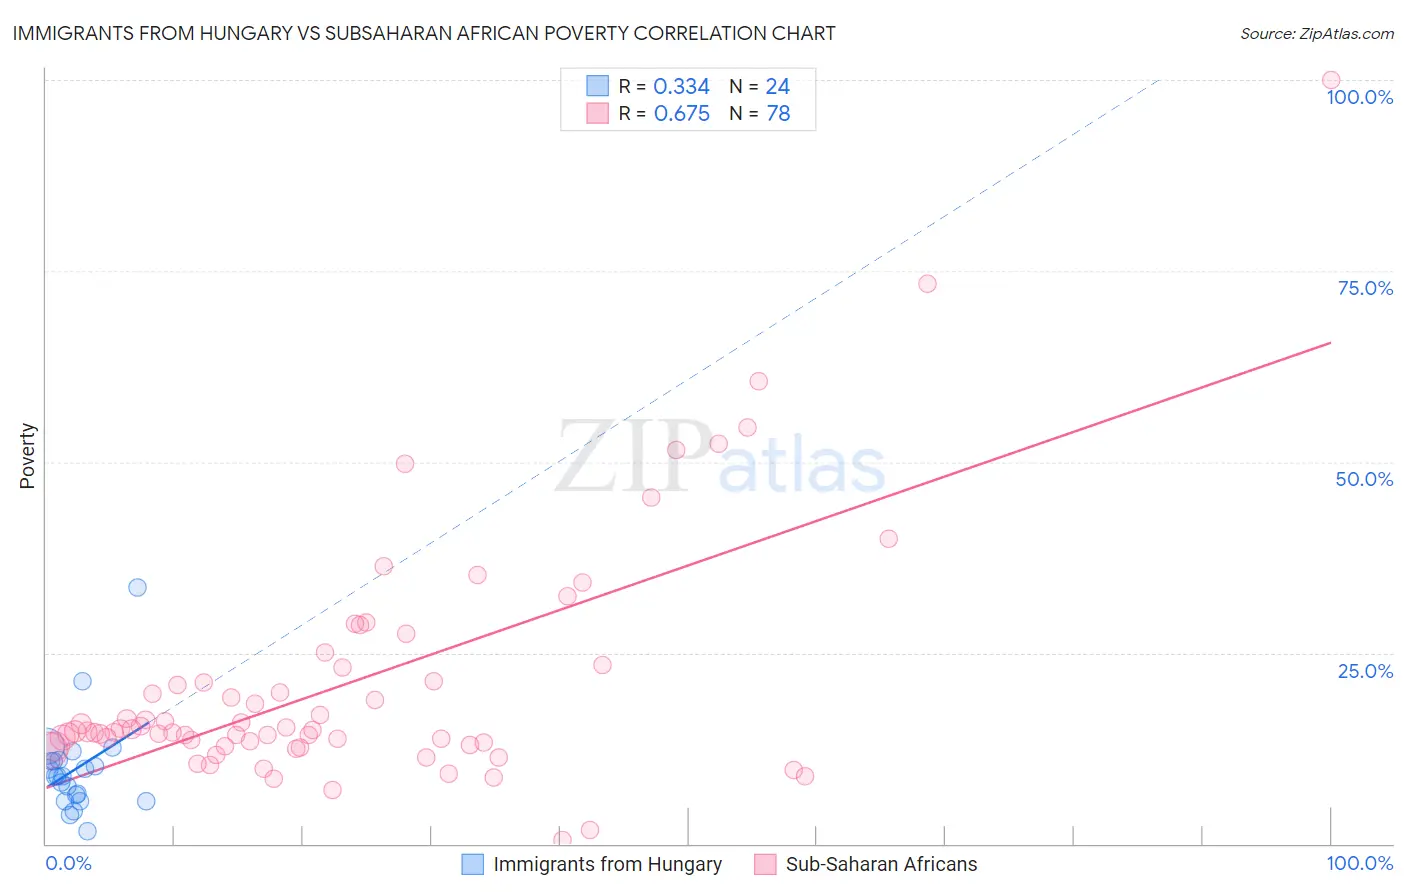
Immigrants from Hungary vs Subsaharan African Poverty Correlation Chart
The statistical analysis conducted on geographies consisting of 195,671,774 people shows a mild positive correlation between the proportion of Immigrants from Hungary and poverty level in the United States with a correlation coefficient (R) of 0.334 and weighted average of 11.7%. Similarly, the statistical analysis conducted on geographies consisting of 507,618,351 people shows a significant positive correlation between the proportion of Sub-Saharan Africans and poverty level in the United States with a correlation coefficient (R) of 0.675 and weighted average of 14.5%, a difference of 24.2%.
Poverty Correlation Summary
| Measurement | Immigrants from Hungary | Subsaharan African |
| Minimum | 1.6% | 0.57% |
| Maximum | 33.5% | 100.0% |
| Range | 31.9% | 99.4% |
| Mean | 9.8% | 21.1% |
| Median | 8.9% | 14.9% |
| Interquartile 25% (IQ1) | 6.0% | 12.9% |
| Interquartile 75% (IQ3) | 10.9% | 23.1% |
| Interquartile Range (IQR) | 4.9% | 10.2% |
| Standard Deviation (Sample) | 6.4% | 16.2% |
| Standard Deviation (Population) | 6.3% | 16.1% |
Similar Demographics by Poverty
Demographics Similar to Immigrants from Hungary by Poverty
In terms of poverty, the demographic groups most similar to Immigrants from Hungary are New Zealander (11.7%, a difference of 0.020%), Puget Sound Salish (11.7%, a difference of 0.020%), Soviet Union (11.7%, a difference of 0.070%), Immigrants from South Eastern Asia (11.7%, a difference of 0.080%), and Tlingit-Haida (11.7%, a difference of 0.090%).
| Demographics | Rating | Rank | Poverty |
| Immigrants | Russia | 89.7 /100 | #116 | Excellent 11.7% |
| Sri Lankans | 89.4 /100 | #117 | Excellent 11.7% |
| Argentineans | 89.1 /100 | #118 | Excellent 11.7% |
| Tlingit-Haida | 89.0 /100 | #119 | Excellent 11.7% |
| Immigrants | South Eastern Asia | 88.9 /100 | #120 | Excellent 11.7% |
| New Zealanders | 88.7 /100 | #121 | Excellent 11.7% |
| Puget Sound Salish | 88.7 /100 | #122 | Excellent 11.7% |
| Immigrants | Hungary | 88.6 /100 | #123 | Excellent 11.7% |
| Soviet Union | 88.4 /100 | #124 | Excellent 11.7% |
| Immigrants | Brazil | 88.2 /100 | #125 | Excellent 11.7% |
| Immigrants | Norway | 88.0 /100 | #126 | Excellent 11.7% |
| Immigrants | Argentina | 88.0 /100 | #127 | Excellent 11.7% |
| Immigrants | Israel | 87.4 /100 | #128 | Excellent 11.7% |
| South Africans | 87.0 /100 | #129 | Excellent 11.7% |
| Immigrants | Ukraine | 86.6 /100 | #130 | Excellent 11.8% |
Demographics Similar to Sub-Saharan Africans by Poverty
In terms of poverty, the demographic groups most similar to Sub-Saharan Africans are Iroquois (14.5%, a difference of 0.040%), Immigrants from Cuba (14.6%, a difference of 0.15%), Central American (14.6%, a difference of 0.29%), Guyanese (14.5%, a difference of 0.35%), and Immigrants from Guyana (14.5%, a difference of 0.52%).
| Demographics | Rating | Rank | Poverty |
| Cherokee | 0.1 /100 | #261 | Tragic 14.4% |
| Immigrants | Liberia | 0.1 /100 | #262 | Tragic 14.4% |
| Jamaicans | 0.1 /100 | #263 | Tragic 14.4% |
| Immigrants | Jamaica | 0.1 /100 | #264 | Tragic 14.4% |
| Immigrants | Guyana | 0.1 /100 | #265 | Tragic 14.5% |
| Guyanese | 0.1 /100 | #266 | Tragic 14.5% |
| Iroquois | 0.1 /100 | #267 | Tragic 14.5% |
| Sub-Saharan Africans | 0.1 /100 | #268 | Tragic 14.5% |
| Immigrants | Cuba | 0.1 /100 | #269 | Tragic 14.6% |
| Central Americans | 0.1 /100 | #270 | Tragic 14.6% |
| Shoshone | 0.0 /100 | #271 | Tragic 14.7% |
| Chickasaw | 0.0 /100 | #272 | Tragic 14.7% |
| Spanish Americans | 0.0 /100 | #273 | Tragic 14.7% |
| Barbadians | 0.0 /100 | #274 | Tragic 14.8% |
| Immigrants | West Indies | 0.0 /100 | #275 | Tragic 14.8% |