Immigrants from Korea vs Venezuelan Poverty
COMPARE
Immigrants from Korea
Venezuelan
Poverty
Poverty Comparison
Immigrants from Korea
Venezuelans
10.7%
POVERTY
99.5/ 100
METRIC RATING
28th/ 347
METRIC RANK
12.2%
POVERTY
56.9/ 100
METRIC RATING
166th/ 347
METRIC RANK
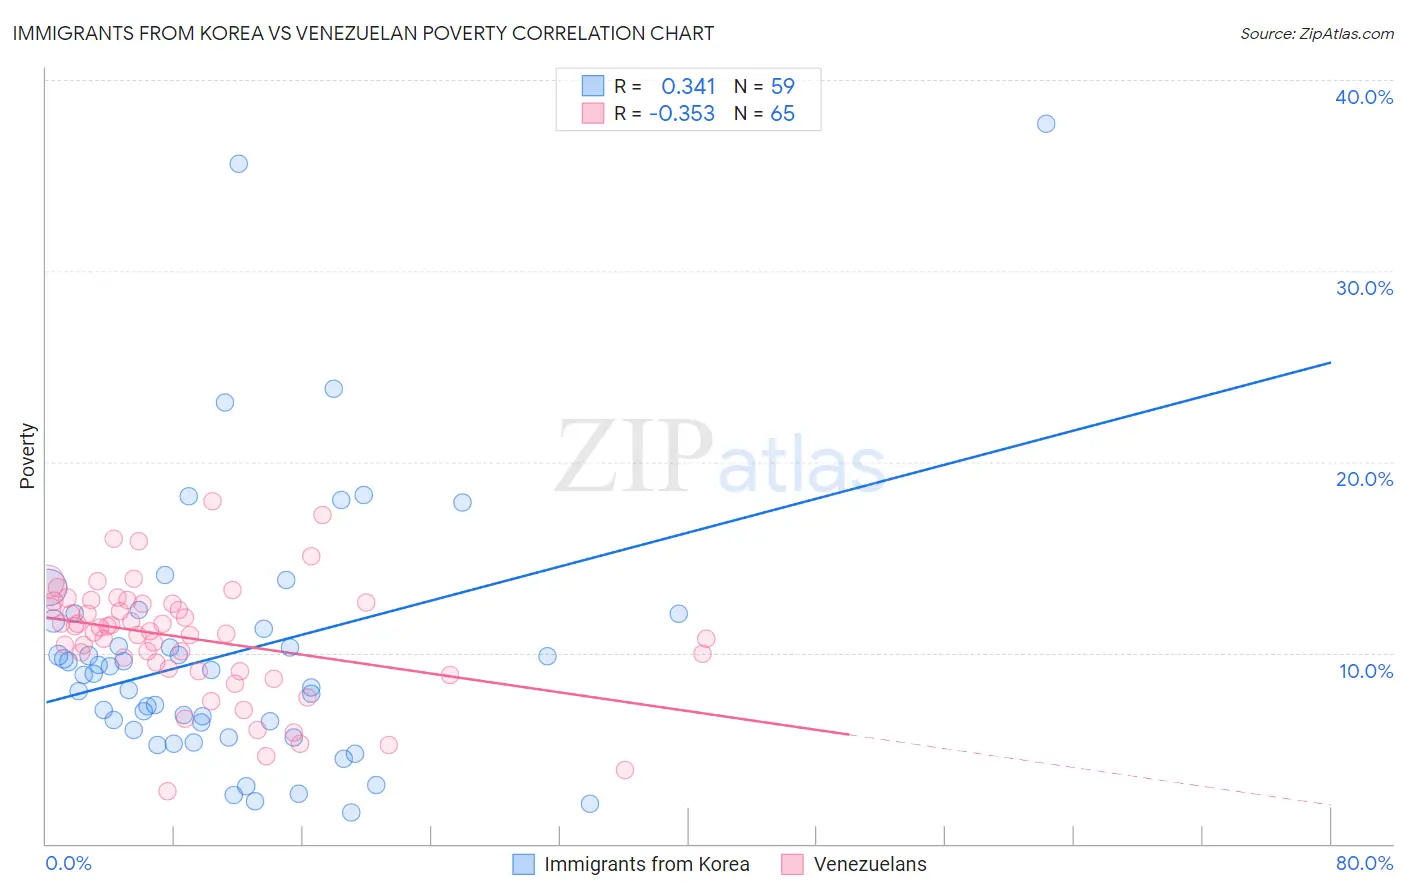
Immigrants from Korea vs Venezuelan Poverty Correlation Chart
The statistical analysis conducted on geographies consisting of 415,974,452 people shows a mild positive correlation between the proportion of Immigrants from Korea and poverty level in the United States with a correlation coefficient (R) of 0.341 and weighted average of 10.7%. Similarly, the statistical analysis conducted on geographies consisting of 306,018,629 people shows a mild negative correlation between the proportion of Venezuelans and poverty level in the United States with a correlation coefficient (R) of -0.353 and weighted average of 12.2%, a difference of 14.2%.
Poverty Correlation Summary
| Measurement | Immigrants from Korea | Venezuelan |
| Minimum | 1.6% | 2.7% |
| Maximum | 37.7% | 17.9% |
| Range | 36.1% | 15.2% |
| Mean | 10.0% | 10.7% |
| Median | 8.9% | 11.1% |
| Interquartile 25% (IQ1) | 5.9% | 9.1% |
| Interquartile 75% (IQ3) | 11.7% | 12.6% |
| Interquartile Range (IQR) | 5.7% | 3.5% |
| Standard Deviation (Sample) | 7.0% | 3.0% |
| Standard Deviation (Population) | 6.9% | 3.0% |
Similar Demographics by Poverty
Demographics Similar to Immigrants from Korea by Poverty
In terms of poverty, the demographic groups most similar to Immigrants from Korea are Immigrants from Northern Europe (10.7%, a difference of 0.070%), Greek (10.7%, a difference of 0.090%), Danish (10.7%, a difference of 0.10%), Polish (10.7%, a difference of 0.19%), and Iranian (10.7%, a difference of 0.27%).
| Demographics | Rating | Rank | Poverty |
| Luxembourgers | 99.7 /100 | #21 | Exceptional 10.6% |
| Eastern Europeans | 99.7 /100 | #22 | Exceptional 10.6% |
| Swedes | 99.7 /100 | #23 | Exceptional 10.6% |
| Italians | 99.7 /100 | #24 | Exceptional 10.6% |
| Croatians | 99.6 /100 | #25 | Exceptional 10.6% |
| Burmese | 99.6 /100 | #26 | Exceptional 10.7% |
| Immigrants | Northern Europe | 99.6 /100 | #27 | Exceptional 10.7% |
| Immigrants | Korea | 99.5 /100 | #28 | Exceptional 10.7% |
| Greeks | 99.5 /100 | #29 | Exceptional 10.7% |
| Danes | 99.5 /100 | #30 | Exceptional 10.7% |
| Poles | 99.5 /100 | #31 | Exceptional 10.7% |
| Iranians | 99.5 /100 | #32 | Exceptional 10.7% |
| Macedonians | 99.4 /100 | #33 | Exceptional 10.8% |
| Immigrants | Poland | 99.4 /100 | #34 | Exceptional 10.8% |
| Tongans | 99.4 /100 | #35 | Exceptional 10.8% |
Demographics Similar to Venezuelans by Poverty
In terms of poverty, the demographic groups most similar to Venezuelans are Immigrants from Chile (12.2%, a difference of 0.020%), Immigrants from Venezuela (12.2%, a difference of 0.040%), Immigrants from Albania (12.2%, a difference of 0.090%), Colombian (12.2%, a difference of 0.10%), and White/Caucasian (12.3%, a difference of 0.15%).
| Demographics | Rating | Rank | Poverty |
| Pennsylvania Germans | 60.8 /100 | #159 | Good 12.2% |
| Immigrants | Nepal | 60.4 /100 | #160 | Good 12.2% |
| Immigrants | Fiji | 59.1 /100 | #161 | Average 12.2% |
| Ethiopians | 59.1 /100 | #162 | Average 12.2% |
| Immigrants | Ethiopia | 58.6 /100 | #163 | Average 12.2% |
| Colombians | 57.8 /100 | #164 | Average 12.2% |
| Immigrants | Albania | 57.7 /100 | #165 | Average 12.2% |
| Venezuelans | 56.9 /100 | #166 | Average 12.2% |
| Immigrants | Chile | 56.7 /100 | #167 | Average 12.2% |
| Immigrants | Venezuela | 56.5 /100 | #168 | Average 12.2% |
| Whites/Caucasians | 55.4 /100 | #169 | Average 12.3% |
| Immigrants | Oceania | 54.6 /100 | #170 | Average 12.3% |
| Immigrants | Spain | 51.3 /100 | #171 | Average 12.3% |
| Immigrants | Portugal | 50.5 /100 | #172 | Average 12.3% |
| Celtics | 50.1 /100 | #173 | Average 12.3% |