Immigrants from Korea vs Immigrants from Costa Rica Poverty
COMPARE
Immigrants from Korea
Immigrants from Costa Rica
Poverty
Poverty Comparison
Immigrants from Korea
Immigrants from Costa Rica
10.7%
POVERTY
99.5/ 100
METRIC RATING
28th/ 347
METRIC RANK
12.5%
POVERTY
33.3/ 100
METRIC RATING
188th/ 347
METRIC RANK
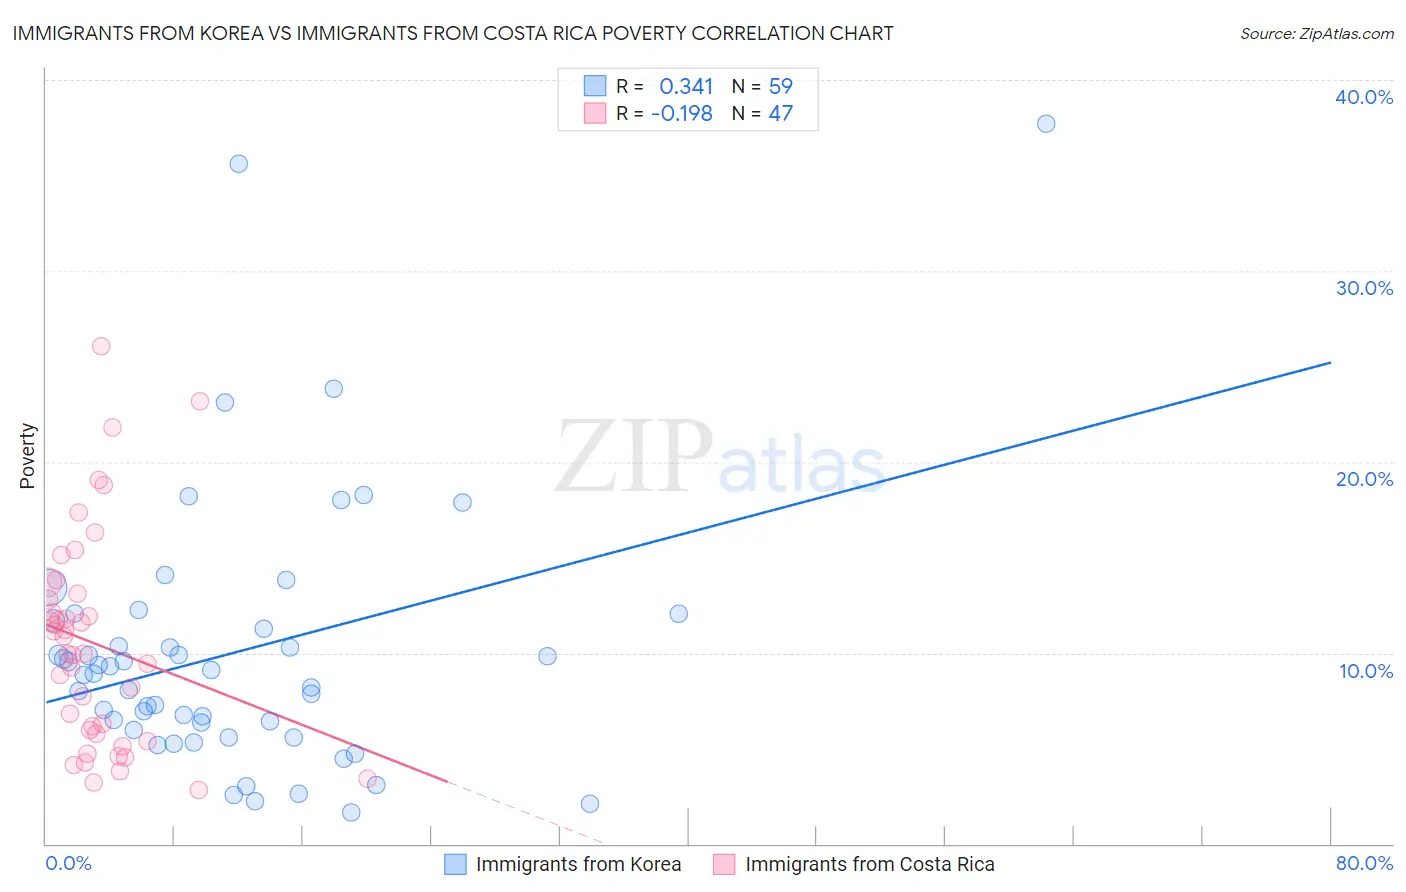
Immigrants from Korea vs Immigrants from Costa Rica Poverty Correlation Chart
The statistical analysis conducted on geographies consisting of 415,974,452 people shows a mild positive correlation between the proportion of Immigrants from Korea and poverty level in the United States with a correlation coefficient (R) of 0.341 and weighted average of 10.7%. Similarly, the statistical analysis conducted on geographies consisting of 204,257,913 people shows a poor negative correlation between the proportion of Immigrants from Costa Rica and poverty level in the United States with a correlation coefficient (R) of -0.198 and weighted average of 12.5%, a difference of 16.9%.
Poverty Correlation Summary
| Measurement | Immigrants from Korea | Immigrants from Costa Rica |
| Minimum | 1.6% | 2.8% |
| Maximum | 37.7% | 26.0% |
| Range | 36.1% | 23.2% |
| Mean | 10.0% | 10.5% |
| Median | 8.9% | 10.0% |
| Interquartile 25% (IQ1) | 5.9% | 5.8% |
| Interquartile 75% (IQ3) | 11.7% | 13.1% |
| Interquartile Range (IQR) | 5.7% | 7.3% |
| Standard Deviation (Sample) | 7.0% | 5.5% |
| Standard Deviation (Population) | 6.9% | 5.5% |
Similar Demographics by Poverty
Demographics Similar to Immigrants from Korea by Poverty
In terms of poverty, the demographic groups most similar to Immigrants from Korea are Immigrants from Northern Europe (10.7%, a difference of 0.070%), Greek (10.7%, a difference of 0.090%), Danish (10.7%, a difference of 0.10%), Polish (10.7%, a difference of 0.19%), and Iranian (10.7%, a difference of 0.27%).
| Demographics | Rating | Rank | Poverty |
| Luxembourgers | 99.7 /100 | #21 | Exceptional 10.6% |
| Eastern Europeans | 99.7 /100 | #22 | Exceptional 10.6% |
| Swedes | 99.7 /100 | #23 | Exceptional 10.6% |
| Italians | 99.7 /100 | #24 | Exceptional 10.6% |
| Croatians | 99.6 /100 | #25 | Exceptional 10.6% |
| Burmese | 99.6 /100 | #26 | Exceptional 10.7% |
| Immigrants | Northern Europe | 99.6 /100 | #27 | Exceptional 10.7% |
| Immigrants | Korea | 99.5 /100 | #28 | Exceptional 10.7% |
| Greeks | 99.5 /100 | #29 | Exceptional 10.7% |
| Danes | 99.5 /100 | #30 | Exceptional 10.7% |
| Poles | 99.5 /100 | #31 | Exceptional 10.7% |
| Iranians | 99.5 /100 | #32 | Exceptional 10.7% |
| Macedonians | 99.4 /100 | #33 | Exceptional 10.8% |
| Immigrants | Poland | 99.4 /100 | #34 | Exceptional 10.8% |
| Tongans | 99.4 /100 | #35 | Exceptional 10.8% |
Demographics Similar to Immigrants from Costa Rica by Poverty
In terms of poverty, the demographic groups most similar to Immigrants from Costa Rica are Aleut (12.5%, a difference of 0.010%), Hawaiian (12.5%, a difference of 0.090%), Immigrants from South America (12.5%, a difference of 0.10%), Sierra Leonean (12.6%, a difference of 0.20%), and Immigrants from Sierra Leone (12.5%, a difference of 0.32%).
| Demographics | Rating | Rank | Poverty |
| Immigrants | Afghanistan | 42.1 /100 | #181 | Average 12.4% |
| Immigrants | Cameroon | 41.7 /100 | #182 | Average 12.4% |
| Immigrants | Iraq | 40.2 /100 | #183 | Average 12.4% |
| Kenyans | 38.8 /100 | #184 | Fair 12.5% |
| Israelis | 36.4 /100 | #185 | Fair 12.5% |
| Immigrants | Sierra Leone | 36.3 /100 | #186 | Fair 12.5% |
| Hawaiians | 34.1 /100 | #187 | Fair 12.5% |
| Immigrants | Costa Rica | 33.3 /100 | #188 | Fair 12.5% |
| Aleuts | 33.2 /100 | #189 | Fair 12.5% |
| Immigrants | South America | 32.3 /100 | #190 | Fair 12.5% |
| Sierra Leoneans | 31.5 /100 | #191 | Fair 12.6% |
| South American Indians | 23.3 /100 | #192 | Fair 12.7% |
| Delaware | 21.4 /100 | #193 | Fair 12.7% |
| Arabs | 21.1 /100 | #194 | Fair 12.7% |
| Immigrants | Kuwait | 20.9 /100 | #195 | Fair 12.7% |