Immigrants from Korea vs Central American Indian Poverty
COMPARE
Immigrants from Korea
Central American Indian
Poverty
Poverty Comparison
Immigrants from Korea
Central American Indians
10.7%
POVERTY
99.5/ 100
METRIC RATING
28th/ 347
METRIC RANK
16.7%
POVERTY
0.0/ 100
METRIC RATING
325th/ 347
METRIC RANK
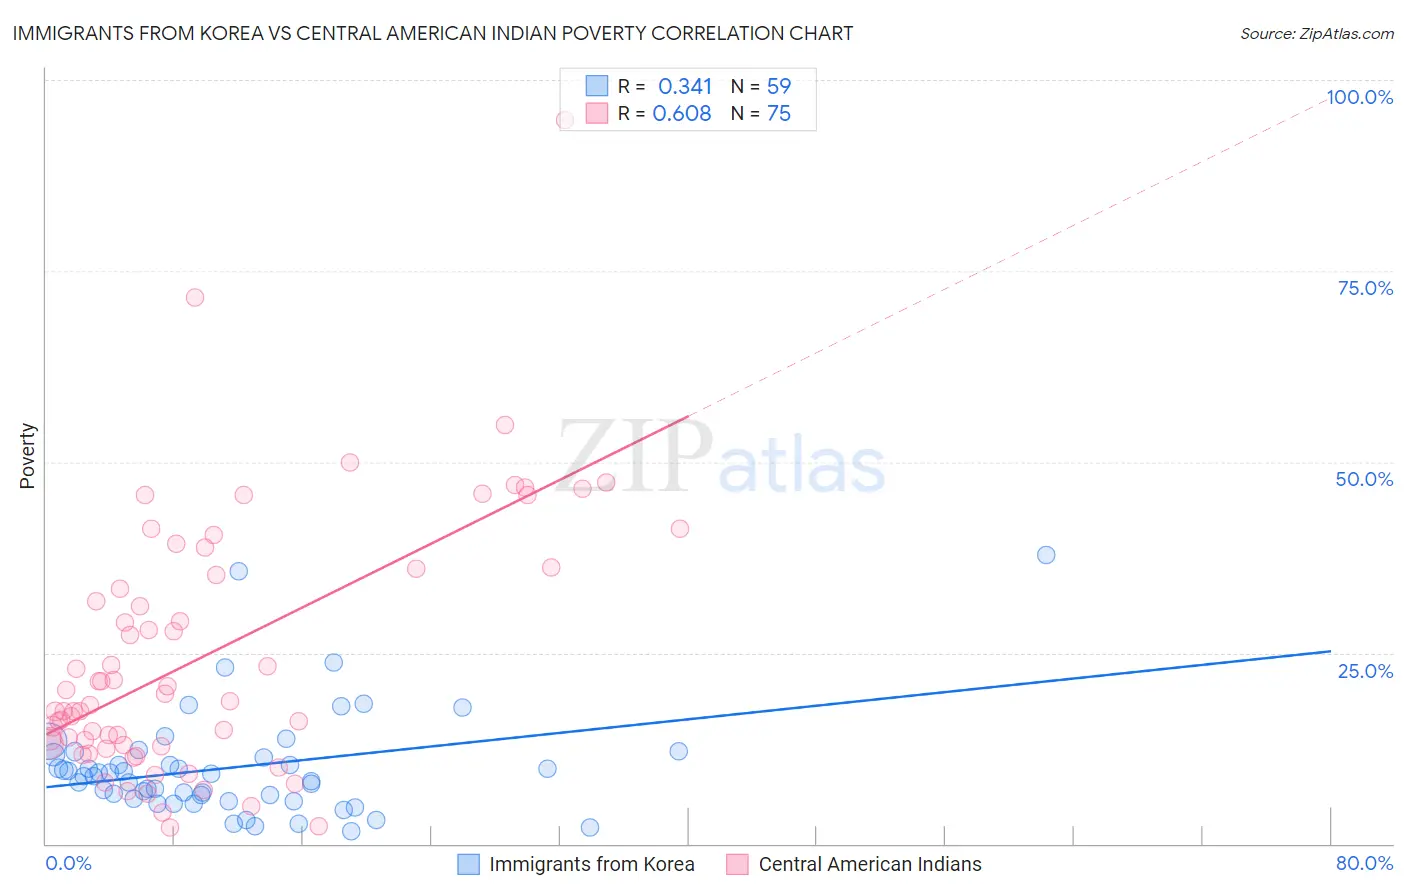
Immigrants from Korea vs Central American Indian Poverty Correlation Chart
The statistical analysis conducted on geographies consisting of 415,974,452 people shows a mild positive correlation between the proportion of Immigrants from Korea and poverty level in the United States with a correlation coefficient (R) of 0.341 and weighted average of 10.7%. Similarly, the statistical analysis conducted on geographies consisting of 326,078,193 people shows a significant positive correlation between the proportion of Central American Indians and poverty level in the United States with a correlation coefficient (R) of 0.608 and weighted average of 16.7%, a difference of 55.8%.
Poverty Correlation Summary
| Measurement | Immigrants from Korea | Central American Indian |
| Minimum | 1.6% | 2.1% |
| Maximum | 37.7% | 94.8% |
| Range | 36.1% | 92.7% |
| Mean | 10.0% | 24.6% |
| Median | 8.9% | 18.6% |
| Interquartile 25% (IQ1) | 5.9% | 12.9% |
| Interquartile 75% (IQ3) | 11.7% | 36.0% |
| Interquartile Range (IQR) | 5.7% | 23.1% |
| Standard Deviation (Sample) | 7.0% | 16.9% |
| Standard Deviation (Population) | 6.9% | 16.8% |
Similar Demographics by Poverty
Demographics Similar to Immigrants from Korea by Poverty
In terms of poverty, the demographic groups most similar to Immigrants from Korea are Immigrants from Northern Europe (10.7%, a difference of 0.070%), Greek (10.7%, a difference of 0.090%), Danish (10.7%, a difference of 0.10%), Polish (10.7%, a difference of 0.19%), and Iranian (10.7%, a difference of 0.27%).
| Demographics | Rating | Rank | Poverty |
| Luxembourgers | 99.7 /100 | #21 | Exceptional 10.6% |
| Eastern Europeans | 99.7 /100 | #22 | Exceptional 10.6% |
| Swedes | 99.7 /100 | #23 | Exceptional 10.6% |
| Italians | 99.7 /100 | #24 | Exceptional 10.6% |
| Croatians | 99.6 /100 | #25 | Exceptional 10.6% |
| Burmese | 99.6 /100 | #26 | Exceptional 10.7% |
| Immigrants | Northern Europe | 99.6 /100 | #27 | Exceptional 10.7% |
| Immigrants | Korea | 99.5 /100 | #28 | Exceptional 10.7% |
| Greeks | 99.5 /100 | #29 | Exceptional 10.7% |
| Danes | 99.5 /100 | #30 | Exceptional 10.7% |
| Poles | 99.5 /100 | #31 | Exceptional 10.7% |
| Iranians | 99.5 /100 | #32 | Exceptional 10.7% |
| Macedonians | 99.4 /100 | #33 | Exceptional 10.8% |
| Immigrants | Poland | 99.4 /100 | #34 | Exceptional 10.8% |
| Tongans | 99.4 /100 | #35 | Exceptional 10.8% |
Demographics Similar to Central American Indians by Poverty
In terms of poverty, the demographic groups most similar to Central American Indians are Yakama (16.7%, a difference of 0.23%), Paiute (16.7%, a difference of 0.29%), Colville (16.6%, a difference of 0.77%), Kiowa (16.8%, a difference of 0.82%), and Ute (16.9%, a difference of 1.3%).
| Demographics | Rating | Rank | Poverty |
| Immigrants | Dominica | 0.0 /100 | #318 | Tragic 16.1% |
| Immigrants | Congo | 0.0 /100 | #319 | Tragic 16.1% |
| Immigrants | Honduras | 0.0 /100 | #320 | Tragic 16.2% |
| Arapaho | 0.0 /100 | #321 | Tragic 16.3% |
| Menominee | 0.0 /100 | #322 | Tragic 16.4% |
| Colville | 0.0 /100 | #323 | Tragic 16.6% |
| Yakama | 0.0 /100 | #324 | Tragic 16.7% |
| Central American Indians | 0.0 /100 | #325 | Tragic 16.7% |
| Paiute | 0.0 /100 | #326 | Tragic 16.7% |
| Kiowa | 0.0 /100 | #327 | Tragic 16.8% |
| Ute | 0.0 /100 | #328 | Tragic 16.9% |
| Blacks/African Americans | 0.0 /100 | #329 | Tragic 17.3% |
| Dominicans | 0.0 /100 | #330 | Tragic 17.6% |
| Immigrants | Dominican Republic | 0.0 /100 | #331 | Tragic 17.8% |
| Natives/Alaskans | 0.0 /100 | #332 | Tragic 18.1% |