Finnish vs Subsaharan African Poverty
COMPARE
Finnish
Subsaharan African
Poverty
Poverty Comparison
Finns
Sub-Saharan Africans
11.4%
POVERTY
95.2/ 100
METRIC RATING
91st/ 347
METRIC RANK
14.5%
POVERTY
0.1/ 100
METRIC RATING
268th/ 347
METRIC RANK
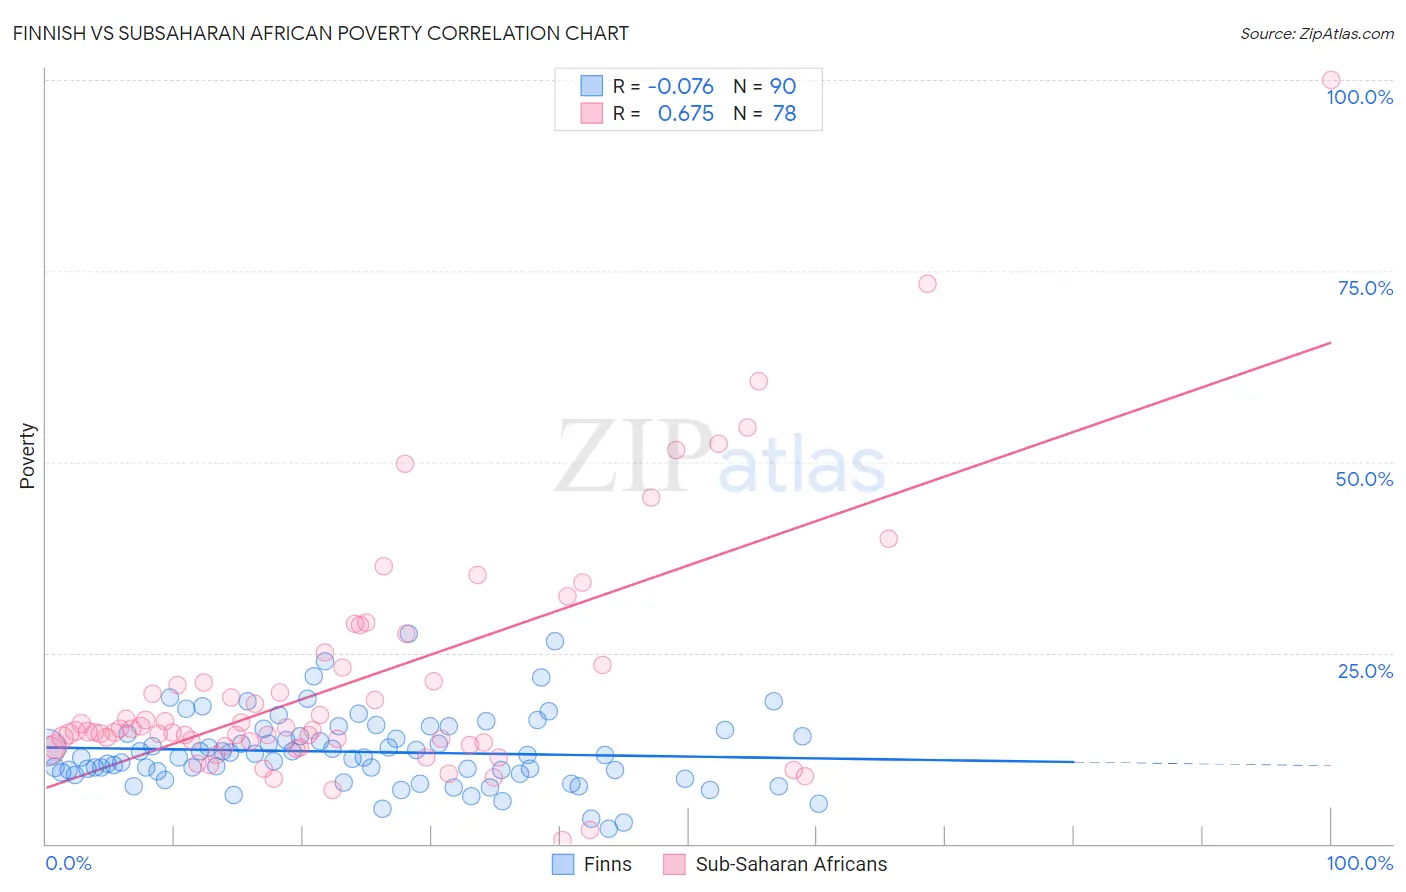
Finnish vs Subsaharan African Poverty Correlation Chart
The statistical analysis conducted on geographies consisting of 404,501,473 people shows a slight negative correlation between the proportion of Finns and poverty level in the United States with a correlation coefficient (R) of -0.076 and weighted average of 11.4%. Similarly, the statistical analysis conducted on geographies consisting of 507,618,351 people shows a significant positive correlation between the proportion of Sub-Saharan Africans and poverty level in the United States with a correlation coefficient (R) of 0.675 and weighted average of 14.5%, a difference of 27.2%.
Poverty Correlation Summary
| Measurement | Finnish | Subsaharan African |
| Minimum | 2.0% | 0.57% |
| Maximum | 27.4% | 100.0% |
| Range | 25.4% | 99.4% |
| Mean | 12.0% | 21.1% |
| Median | 11.5% | 14.9% |
| Interquartile 25% (IQ1) | 9.4% | 12.9% |
| Interquartile 75% (IQ3) | 14.5% | 23.1% |
| Interquartile Range (IQR) | 5.1% | 10.2% |
| Standard Deviation (Sample) | 4.8% | 16.2% |
| Standard Deviation (Population) | 4.8% | 16.1% |
Similar Demographics by Poverty
Demographics Similar to Finns by Poverty
In terms of poverty, the demographic groups most similar to Finns are Immigrants from Denmark (11.4%, a difference of 0.13%), British (11.4%, a difference of 0.14%), Romanian (11.4%, a difference of 0.17%), Paraguayan (11.4%, a difference of 0.19%), and Australian (11.4%, a difference of 0.20%).
| Demographics | Rating | Rank | Poverty |
| English | 96.3 /100 | #84 | Exceptional 11.3% |
| Immigrants | England | 96.2 /100 | #85 | Exceptional 11.4% |
| Jordanians | 96.0 /100 | #86 | Exceptional 11.4% |
| Northern Europeans | 96.0 /100 | #87 | Exceptional 11.4% |
| Belgians | 95.8 /100 | #88 | Exceptional 11.4% |
| Czechoslovakians | 95.7 /100 | #89 | Exceptional 11.4% |
| Immigrants | Denmark | 95.5 /100 | #90 | Exceptional 11.4% |
| Finns | 95.2 /100 | #91 | Exceptional 11.4% |
| British | 95.0 /100 | #92 | Exceptional 11.4% |
| Romanians | 94.9 /100 | #93 | Exceptional 11.4% |
| Paraguayans | 94.9 /100 | #94 | Exceptional 11.4% |
| Australians | 94.9 /100 | #95 | Exceptional 11.4% |
| Immigrants | South Africa | 94.7 /100 | #96 | Exceptional 11.5% |
| Immigrants | Egypt | 94.6 /100 | #97 | Exceptional 11.5% |
| Immigrants | Latvia | 94.5 /100 | #98 | Exceptional 11.5% |
Demographics Similar to Sub-Saharan Africans by Poverty
In terms of poverty, the demographic groups most similar to Sub-Saharan Africans are Iroquois (14.5%, a difference of 0.040%), Immigrants from Cuba (14.6%, a difference of 0.15%), Central American (14.6%, a difference of 0.29%), Guyanese (14.5%, a difference of 0.35%), and Immigrants from Guyana (14.5%, a difference of 0.52%).
| Demographics | Rating | Rank | Poverty |
| Cherokee | 0.1 /100 | #261 | Tragic 14.4% |
| Immigrants | Liberia | 0.1 /100 | #262 | Tragic 14.4% |
| Jamaicans | 0.1 /100 | #263 | Tragic 14.4% |
| Immigrants | Jamaica | 0.1 /100 | #264 | Tragic 14.4% |
| Immigrants | Guyana | 0.1 /100 | #265 | Tragic 14.5% |
| Guyanese | 0.1 /100 | #266 | Tragic 14.5% |
| Iroquois | 0.1 /100 | #267 | Tragic 14.5% |
| Sub-Saharan Africans | 0.1 /100 | #268 | Tragic 14.5% |
| Immigrants | Cuba | 0.1 /100 | #269 | Tragic 14.6% |
| Central Americans | 0.1 /100 | #270 | Tragic 14.6% |
| Shoshone | 0.0 /100 | #271 | Tragic 14.7% |
| Chickasaw | 0.0 /100 | #272 | Tragic 14.7% |
| Spanish Americans | 0.0 /100 | #273 | Tragic 14.7% |
| Barbadians | 0.0 /100 | #274 | Tragic 14.8% |
| Immigrants | West Indies | 0.0 /100 | #275 | Tragic 14.8% |