Immigrants from Korea vs Immigrants from Romania Poverty
COMPARE
Immigrants from Korea
Immigrants from Romania
Poverty
Poverty Comparison
Immigrants from Korea
Immigrants from Romania
10.7%
POVERTY
99.5/ 100
METRIC RATING
28th/ 347
METRIC RANK
11.0%
POVERTY
98.9/ 100
METRIC RATING
47th/ 347
METRIC RANK
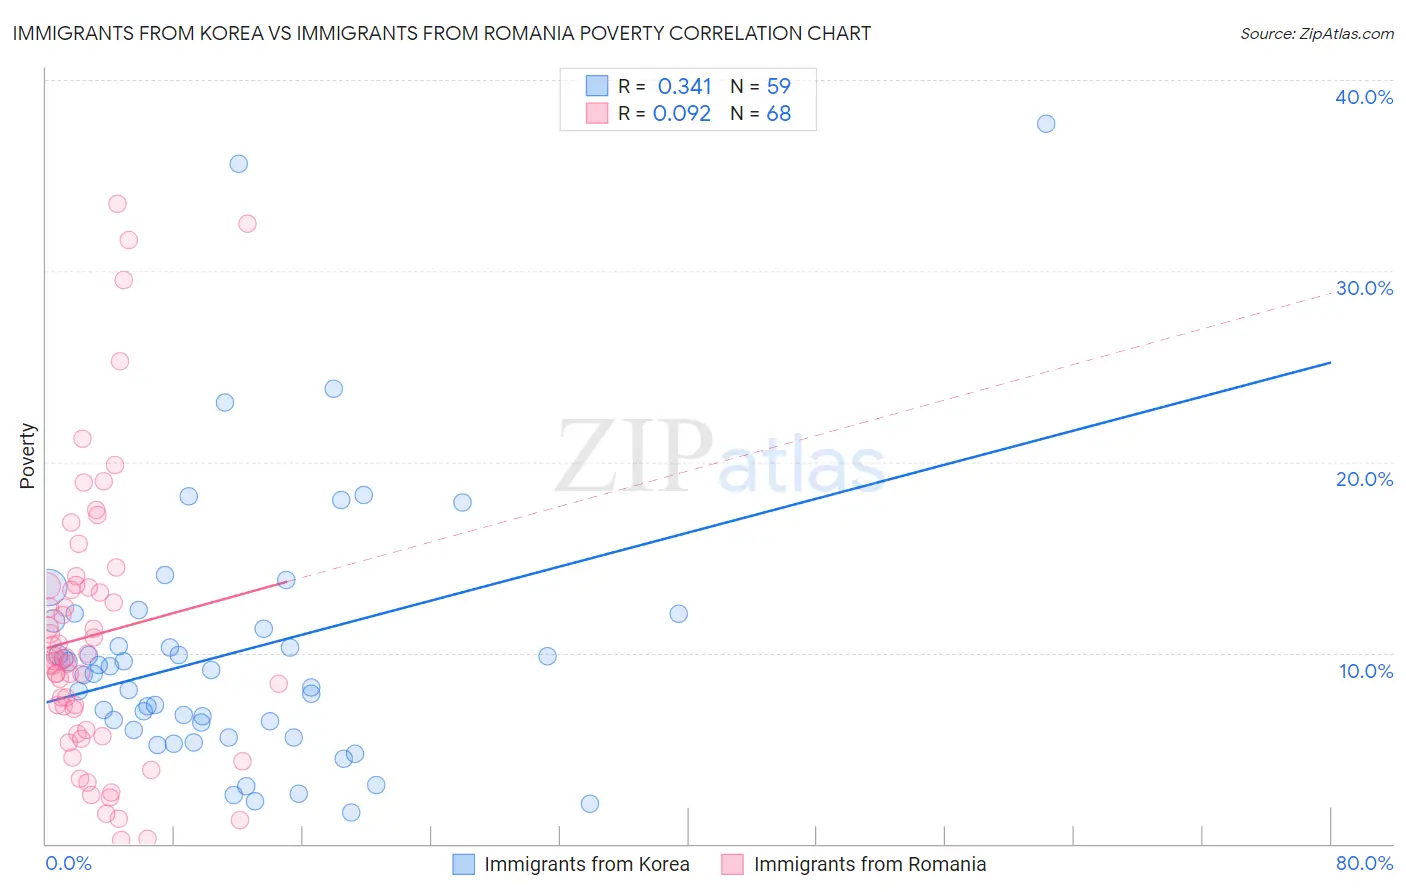
Immigrants from Korea vs Immigrants from Romania Poverty Correlation Chart
The statistical analysis conducted on geographies consisting of 415,974,452 people shows a mild positive correlation between the proportion of Immigrants from Korea and poverty level in the United States with a correlation coefficient (R) of 0.341 and weighted average of 10.7%. Similarly, the statistical analysis conducted on geographies consisting of 256,937,663 people shows a slight positive correlation between the proportion of Immigrants from Romania and poverty level in the United States with a correlation coefficient (R) of 0.092 and weighted average of 11.0%, a difference of 2.4%.
Poverty Correlation Summary
| Measurement | Immigrants from Korea | Immigrants from Romania |
| Minimum | 1.6% | 0.19% |
| Maximum | 37.7% | 33.5% |
| Range | 36.1% | 33.4% |
| Mean | 10.0% | 10.9% |
| Median | 8.9% | 9.6% |
| Interquartile 25% (IQ1) | 5.9% | 5.9% |
| Interquartile 75% (IQ3) | 11.7% | 13.4% |
| Interquartile Range (IQR) | 5.7% | 7.6% |
| Standard Deviation (Sample) | 7.0% | 7.4% |
| Standard Deviation (Population) | 6.9% | 7.4% |
Demographics Similar to Immigrants from Korea and Immigrants from Romania by Poverty
In terms of poverty, the demographic groups most similar to Immigrants from Korea are Immigrants from Northern Europe (10.7%, a difference of 0.070%), Greek (10.7%, a difference of 0.090%), Danish (10.7%, a difference of 0.10%), Polish (10.7%, a difference of 0.19%), and Iranian (10.7%, a difference of 0.27%). Similarly, the demographic groups most similar to Immigrants from Romania are Immigrants from Czechoslovakia (11.0%, a difference of 0.010%), Turkish (11.0%, a difference of 0.10%), Immigrants from Moldova (10.9%, a difference of 0.61%), Immigrants from Singapore (10.9%, a difference of 0.75%), and Korean (10.9%, a difference of 0.80%).
| Demographics | Rating | Rank | Poverty |
| Immigrants | Northern Europe | 99.6 /100 | #27 | Exceptional 10.7% |
| Immigrants | Korea | 99.5 /100 | #28 | Exceptional 10.7% |
| Greeks | 99.5 /100 | #29 | Exceptional 10.7% |
| Danes | 99.5 /100 | #30 | Exceptional 10.7% |
| Poles | 99.5 /100 | #31 | Exceptional 10.7% |
| Iranians | 99.5 /100 | #32 | Exceptional 10.7% |
| Macedonians | 99.4 /100 | #33 | Exceptional 10.8% |
| Immigrants | Poland | 99.4 /100 | #34 | Exceptional 10.8% |
| Tongans | 99.4 /100 | #35 | Exceptional 10.8% |
| Cypriots | 99.3 /100 | #36 | Exceptional 10.8% |
| Immigrants | Greece | 99.3 /100 | #37 | Exceptional 10.8% |
| Czechs | 99.3 /100 | #38 | Exceptional 10.8% |
| Immigrants | Pakistan | 99.3 /100 | #39 | Exceptional 10.8% |
| Russians | 99.3 /100 | #40 | Exceptional 10.9% |
| Immigrants | Iran | 99.2 /100 | #41 | Exceptional 10.9% |
| Koreans | 99.2 /100 | #42 | Exceptional 10.9% |
| Immigrants | Singapore | 99.2 /100 | #43 | Exceptional 10.9% |
| Immigrants | Moldova | 99.1 /100 | #44 | Exceptional 10.9% |
| Turks | 98.9 /100 | #45 | Exceptional 11.0% |
| Immigrants | Czechoslovakia | 98.9 /100 | #46 | Exceptional 11.0% |
| Immigrants | Romania | 98.9 /100 | #47 | Exceptional 11.0% |