Immigrants from Korea vs Lithuanian Median Female Earnings
COMPARE
Immigrants from Korea
Lithuanian
Median Female Earnings
Median Female Earnings Comparison
Immigrants from Korea
Lithuanians
$44,847
MEDIAN FEMALE EARNINGS
100.0/ 100
METRIC RATING
24th/ 347
METRIC RANK
$42,108
MEDIAN FEMALE EARNINGS
99.3/ 100
METRIC RATING
87th/ 347
METRIC RANK
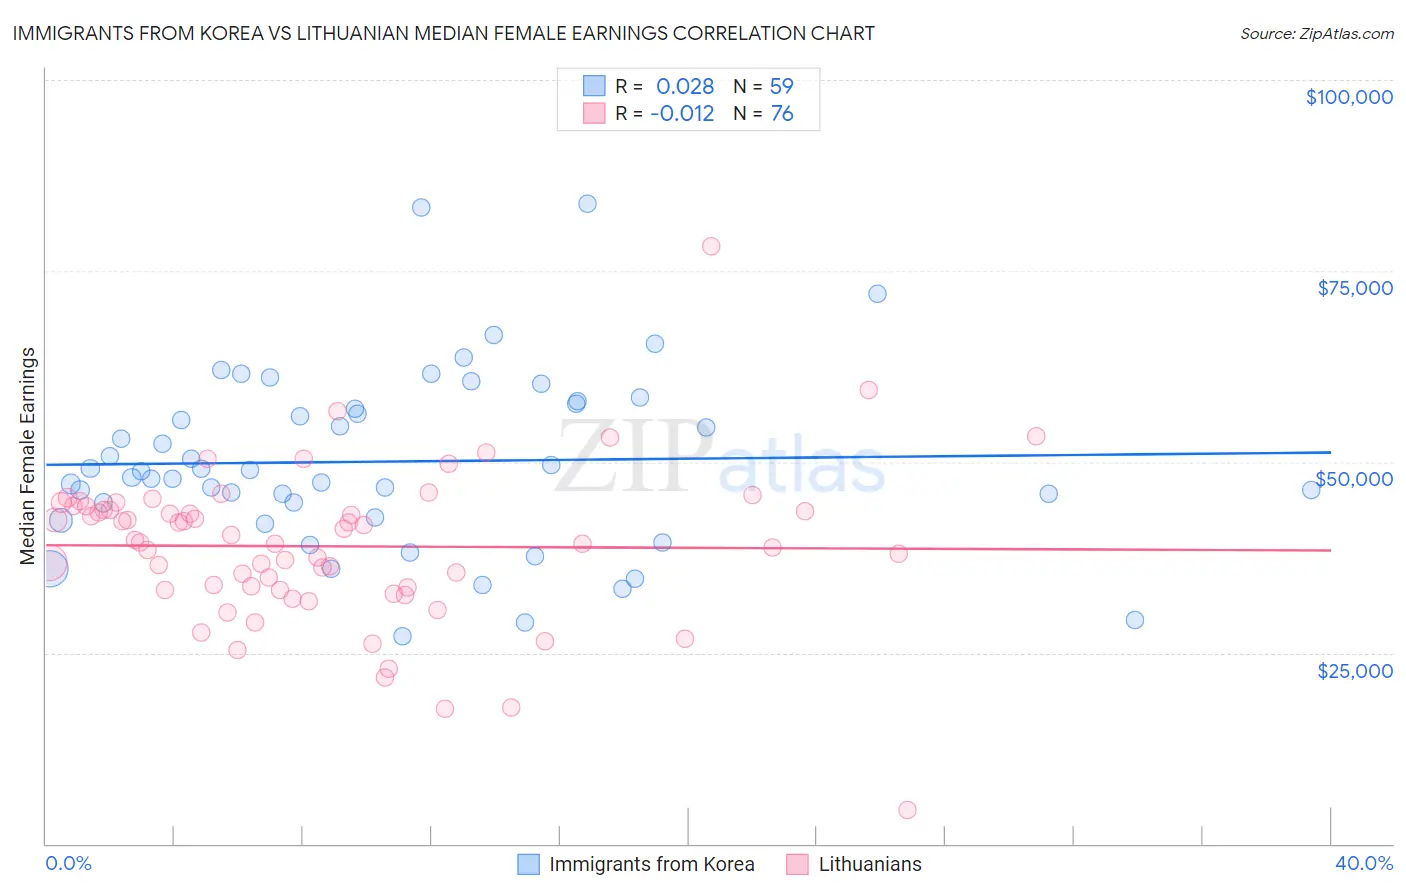
Immigrants from Korea vs Lithuanian Median Female Earnings Correlation Chart
The statistical analysis conducted on geographies consisting of 416,108,696 people shows no correlation between the proportion of Immigrants from Korea and median female earnings in the United States with a correlation coefficient (R) of 0.028 and weighted average of $44,847. Similarly, the statistical analysis conducted on geographies consisting of 421,690,318 people shows no correlation between the proportion of Lithuanians and median female earnings in the United States with a correlation coefficient (R) of -0.012 and weighted average of $42,108, a difference of 6.5%.
Median Female Earnings Correlation Summary
| Measurement | Immigrants from Korea | Lithuanian |
| Minimum | $27,183 | $4,435 |
| Maximum | $83,750 | $78,167 |
| Range | $56,567 | $73,732 |
| Mean | $50,048 | $38,946 |
| Median | $48,754 | $39,620 |
| Interquartile 25% (IQ1) | $42,787 | $33,413 |
| Interquartile 75% (IQ3) | $57,558 | $43,909 |
| Interquartile Range (IQR) | $14,771 | $10,496 |
| Standard Deviation (Sample) | $11,764 | $10,262 |
| Standard Deviation (Population) | $11,664 | $10,194 |
Similar Demographics by Median Female Earnings
Demographics Similar to Immigrants from Korea by Median Female Earnings
In terms of median female earnings, the demographic groups most similar to Immigrants from Korea are Burmese ($44,911, a difference of 0.14%), Immigrants from Sweden ($44,774, a difference of 0.16%), Immigrants from Belarus ($44,757, a difference of 0.20%), Immigrants from Greece ($44,976, a difference of 0.29%), and Turkish ($44,695, a difference of 0.34%).
| Demographics | Rating | Rank | Median Female Earnings |
| Immigrants | South Central Asia | 100.0 /100 | #17 | Exceptional $46,324 |
| Cypriots | 100.0 /100 | #18 | Exceptional $45,570 |
| Eastern Europeans | 100.0 /100 | #19 | Exceptional $45,385 |
| Immigrants | Japan | 100.0 /100 | #20 | Exceptional $45,323 |
| Cambodians | 100.0 /100 | #21 | Exceptional $45,014 |
| Immigrants | Greece | 100.0 /100 | #22 | Exceptional $44,976 |
| Burmese | 100.0 /100 | #23 | Exceptional $44,911 |
| Immigrants | Korea | 100.0 /100 | #24 | Exceptional $44,847 |
| Immigrants | Sweden | 100.0 /100 | #25 | Exceptional $44,774 |
| Immigrants | Belarus | 100.0 /100 | #26 | Exceptional $44,757 |
| Turks | 100.0 /100 | #27 | Exceptional $44,695 |
| Immigrants | Russia | 100.0 /100 | #28 | Exceptional $44,680 |
| Immigrants | Belgium | 100.0 /100 | #29 | Exceptional $44,587 |
| Asians | 100.0 /100 | #30 | Exceptional $44,586 |
| Immigrants | France | 100.0 /100 | #31 | Exceptional $44,541 |
Demographics Similar to Lithuanians by Median Female Earnings
In terms of median female earnings, the demographic groups most similar to Lithuanians are Immigrants from St. Vincent and the Grenadines ($42,108, a difference of 0.0%), Laotian ($42,133, a difference of 0.060%), Immigrants from Northern Africa ($42,084, a difference of 0.060%), Immigrants from Afghanistan ($42,055, a difference of 0.12%), and Ukrainian ($42,015, a difference of 0.22%).
| Demographics | Rating | Rank | Median Female Earnings |
| Immigrants | Moldova | 99.6 /100 | #80 | Exceptional $42,304 |
| Immigrants | Southern Europe | 99.5 /100 | #81 | Exceptional $42,275 |
| Immigrants | Morocco | 99.5 /100 | #82 | Exceptional $42,229 |
| Immigrants | Sierra Leone | 99.5 /100 | #83 | Exceptional $42,214 |
| Armenians | 99.5 /100 | #84 | Exceptional $42,212 |
| Laotians | 99.4 /100 | #85 | Exceptional $42,133 |
| Immigrants | St. Vincent and the Grenadines | 99.3 /100 | #86 | Exceptional $42,108 |
| Lithuanians | 99.3 /100 | #87 | Exceptional $42,108 |
| Immigrants | Northern Africa | 99.3 /100 | #88 | Exceptional $42,084 |
| Immigrants | Afghanistan | 99.3 /100 | #89 | Exceptional $42,055 |
| Ukrainians | 99.2 /100 | #90 | Exceptional $42,015 |
| Immigrants | Western Europe | 99.2 /100 | #91 | Exceptional $41,990 |
| Argentineans | 99.1 /100 | #92 | Exceptional $41,952 |
| Immigrants | Grenada | 99.0 /100 | #93 | Exceptional $41,932 |
| Moroccans | 98.9 /100 | #94 | Exceptional $41,872 |