Immigrants from Korea vs Lithuanian Births to Unmarried Women
COMPARE
Immigrants from Korea
Lithuanian
Births to Unmarried Women
Births to Unmarried Women Comparison
Immigrants from Korea
Lithuanians
26.3%
BIRTHS TO UNMARRIED WOMEN
99.9/ 100
METRIC RATING
20th/ 347
METRIC RANK
29.6%
BIRTHS TO UNMARRIED WOMEN
94.4/ 100
METRIC RATING
104th/ 347
METRIC RANK
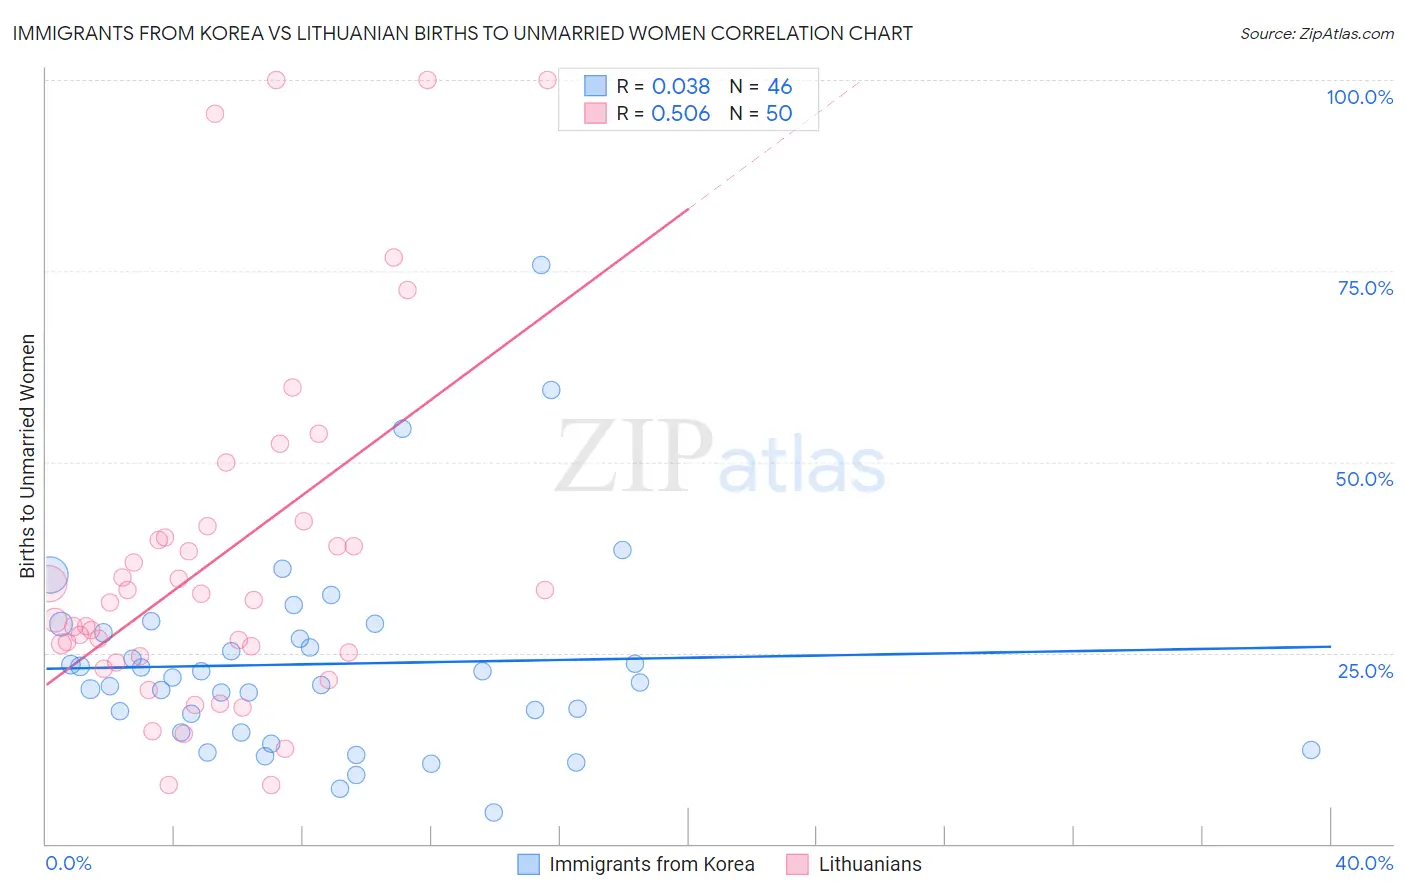
Immigrants from Korea vs Lithuanian Births to Unmarried Women Correlation Chart
The statistical analysis conducted on geographies consisting of 385,969,141 people shows no correlation between the proportion of Immigrants from Korea and percentage of births to unmarried women in the United States with a correlation coefficient (R) of 0.038 and weighted average of 26.3%. Similarly, the statistical analysis conducted on geographies consisting of 385,212,926 people shows a substantial positive correlation between the proportion of Lithuanians and percentage of births to unmarried women in the United States with a correlation coefficient (R) of 0.506 and weighted average of 29.6%, a difference of 12.5%.
Births to Unmarried Women Correlation Summary
| Measurement | Immigrants from Korea | Lithuanian |
| Minimum | 4.1% | 7.7% |
| Maximum | 75.8% | 100.0% |
| Range | 71.7% | 92.3% |
| Mean | 23.5% | 37.3% |
| Median | 21.4% | 31.8% |
| Interquartile 25% (IQ1) | 14.6% | 24.6% |
| Interquartile 75% (IQ3) | 27.6% | 40.0% |
| Interquartile Range (IQR) | 13.0% | 15.4% |
| Standard Deviation (Sample) | 13.3% | 23.1% |
| Standard Deviation (Population) | 13.2% | 22.9% |
Similar Demographics by Births to Unmarried Women
Demographics Similar to Immigrants from Korea by Births to Unmarried Women
In terms of births to unmarried women, the demographic groups most similar to Immigrants from Korea are Soviet Union (26.3%, a difference of 0.13%), Armenian (26.2%, a difference of 0.21%), Burmese (26.4%, a difference of 0.36%), Immigrants from Japan (26.4%, a difference of 0.55%), and Immigrants from Armenia (26.1%, a difference of 0.80%).
| Demographics | Rating | Rank | Births to Unmarried Women |
| Iranians | 100.0 /100 | #13 | Exceptional 25.3% |
| Immigrants | Lebanon | 100.0 /100 | #14 | Exceptional 25.3% |
| Immigrants | Singapore | 100.0 /100 | #15 | Exceptional 25.6% |
| Immigrants | Belarus | 100.0 /100 | #16 | Exceptional 25.6% |
| Immigrants | Uzbekistan | 100.0 /100 | #17 | Exceptional 25.8% |
| Immigrants | Armenia | 99.9 /100 | #18 | Exceptional 26.1% |
| Armenians | 99.9 /100 | #19 | Exceptional 26.2% |
| Immigrants | Korea | 99.9 /100 | #20 | Exceptional 26.3% |
| Soviet Union | 99.9 /100 | #21 | Exceptional 26.3% |
| Burmese | 99.9 /100 | #22 | Exceptional 26.4% |
| Immigrants | Japan | 99.9 /100 | #23 | Exceptional 26.4% |
| Immigrants | Australia | 99.9 /100 | #24 | Exceptional 26.6% |
| Cambodians | 99.9 /100 | #25 | Exceptional 26.7% |
| Asians | 99.9 /100 | #26 | Exceptional 26.8% |
| Immigrants | Asia | 99.9 /100 | #27 | Exceptional 26.8% |
Demographics Similar to Lithuanians by Births to Unmarried Women
In terms of births to unmarried women, the demographic groups most similar to Lithuanians are Lebanese (29.5%, a difference of 0.010%), Immigrants from Nepal (29.6%, a difference of 0.050%), Australian (29.5%, a difference of 0.060%), Immigrants from Northern Africa (29.5%, a difference of 0.14%), and Swedish (29.6%, a difference of 0.30%).
| Demographics | Rating | Rank | Births to Unmarried Women |
| Immigrants | South Africa | 95.7 /100 | #97 | Exceptional 29.3% |
| Immigrants | Syria | 95.7 /100 | #98 | Exceptional 29.4% |
| Immigrants | Denmark | 95.3 /100 | #99 | Exceptional 29.4% |
| Luxembourgers | 95.2 /100 | #100 | Exceptional 29.4% |
| Immigrants | Northern Africa | 94.7 /100 | #101 | Exceptional 29.5% |
| Australians | 94.6 /100 | #102 | Exceptional 29.5% |
| Lebanese | 94.4 /100 | #103 | Exceptional 29.5% |
| Lithuanians | 94.4 /100 | #104 | Exceptional 29.6% |
| Immigrants | Nepal | 94.3 /100 | #105 | Exceptional 29.6% |
| Swedes | 93.8 /100 | #106 | Exceptional 29.6% |
| Immigrants | Brazil | 93.7 /100 | #107 | Exceptional 29.6% |
| Paraguayans | 93.5 /100 | #108 | Exceptional 29.7% |
| Greeks | 93.4 /100 | #109 | Exceptional 29.7% |
| Immigrants | Ethiopia | 93.4 /100 | #110 | Exceptional 29.7% |
| Immigrants | Hungary | 93.0 /100 | #111 | Exceptional 29.7% |