Immigrants from Middle Africa vs Lithuanian Poverty
COMPARE
Immigrants from Middle Africa
Lithuanian
Poverty
Poverty Comparison
Immigrants from Middle Africa
Lithuanians
14.0%
POVERTY
0.4/ 100
METRIC RATING
240th/ 347
METRIC RANK
10.5%
POVERTY
99.8/ 100
METRIC RATING
16th/ 347
METRIC RANK
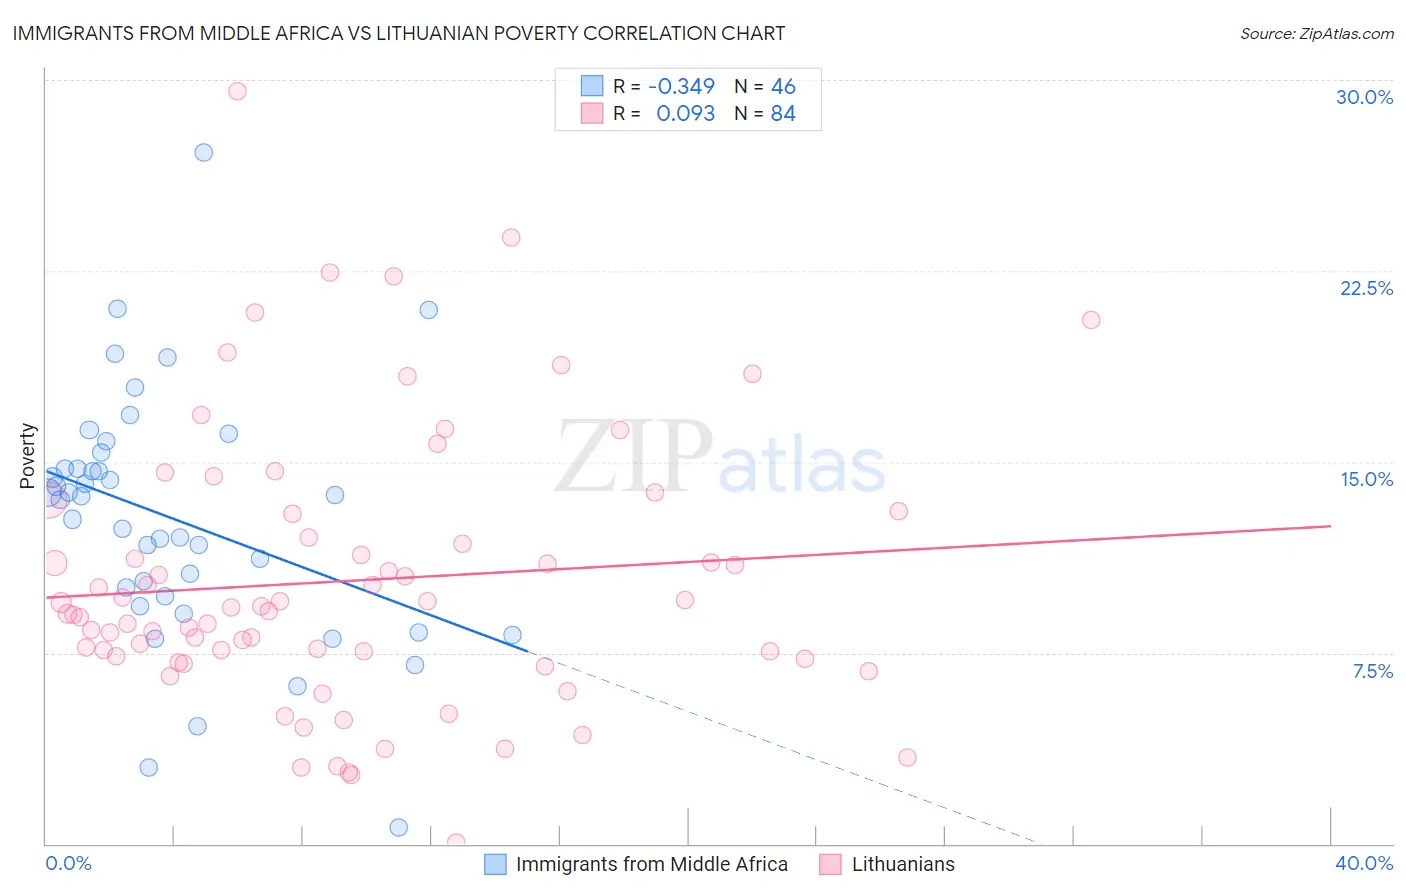
Immigrants from Middle Africa vs Lithuanian Poverty Correlation Chart
The statistical analysis conducted on geographies consisting of 202,643,852 people shows a mild negative correlation between the proportion of Immigrants from Middle Africa and poverty level in the United States with a correlation coefficient (R) of -0.349 and weighted average of 14.0%. Similarly, the statistical analysis conducted on geographies consisting of 421,719,572 people shows a slight positive correlation between the proportion of Lithuanians and poverty level in the United States with a correlation coefficient (R) of 0.093 and weighted average of 10.5%, a difference of 33.3%.
Poverty Correlation Summary
| Measurement | Immigrants from Middle Africa | Lithuanian |
| Minimum | 0.62% | 0.071% |
| Maximum | 27.1% | 29.6% |
| Range | 26.5% | 29.5% |
| Mean | 12.8% | 10.3% |
| Median | 13.6% | 9.2% |
| Interquartile 25% (IQ1) | 9.7% | 7.3% |
| Interquartile 75% (IQ3) | 14.7% | 12.5% |
| Interquartile Range (IQR) | 5.0% | 5.2% |
| Standard Deviation (Sample) | 4.9% | 5.4% |
| Standard Deviation (Population) | 4.8% | 5.4% |
Similar Demographics by Poverty
Demographics Similar to Immigrants from Middle Africa by Poverty
In terms of poverty, the demographic groups most similar to Immigrants from Middle Africa are Salvadoran (14.0%, a difference of 0.020%), Nicaraguan (13.9%, a difference of 0.12%), Ecuadorian (14.0%, a difference of 0.34%), Sudanese (14.0%, a difference of 0.41%), and Nepalese (14.0%, a difference of 0.44%).
| Demographics | Rating | Rank | Poverty |
| Immigrants | Saudi Arabia | 0.8 /100 | #233 | Tragic 13.8% |
| Immigrants | Laos | 0.7 /100 | #234 | Tragic 13.8% |
| Cubans | 0.6 /100 | #235 | Tragic 13.9% |
| Immigrants | Armenia | 0.5 /100 | #236 | Tragic 13.9% |
| French American Indians | 0.5 /100 | #237 | Tragic 13.9% |
| Ghanaians | 0.5 /100 | #238 | Tragic 13.9% |
| Nicaraguans | 0.4 /100 | #239 | Tragic 13.9% |
| Immigrants | Middle Africa | 0.4 /100 | #240 | Tragic 14.0% |
| Salvadorans | 0.4 /100 | #241 | Tragic 14.0% |
| Ecuadorians | 0.4 /100 | #242 | Tragic 14.0% |
| Sudanese | 0.3 /100 | #243 | Tragic 14.0% |
| Nepalese | 0.3 /100 | #244 | Tragic 14.0% |
| Immigrants | Sudan | 0.3 /100 | #245 | Tragic 14.1% |
| Potawatomi | 0.3 /100 | #246 | Tragic 14.1% |
| Liberians | 0.2 /100 | #247 | Tragic 14.1% |
Demographics Similar to Lithuanians by Poverty
In terms of poverty, the demographic groups most similar to Lithuanians are Bolivian (10.4%, a difference of 0.30%), Immigrants from Bolivia (10.4%, a difference of 0.31%), Norwegian (10.5%, a difference of 0.37%), Latvian (10.5%, a difference of 0.46%), and Immigrants from Hong Kong (10.4%, a difference of 0.62%).
| Demographics | Rating | Rank | Poverty |
| Immigrants | South Central Asia | 99.9 /100 | #9 | Exceptional 10.2% |
| Bulgarians | 99.9 /100 | #10 | Exceptional 10.2% |
| Immigrants | Lithuania | 99.9 /100 | #11 | Exceptional 10.3% |
| Bhutanese | 99.8 /100 | #12 | Exceptional 10.4% |
| Immigrants | Hong Kong | 99.8 /100 | #13 | Exceptional 10.4% |
| Immigrants | Bolivia | 99.8 /100 | #14 | Exceptional 10.4% |
| Bolivians | 99.8 /100 | #15 | Exceptional 10.4% |
| Lithuanians | 99.8 /100 | #16 | Exceptional 10.5% |
| Norwegians | 99.8 /100 | #17 | Exceptional 10.5% |
| Latvians | 99.8 /100 | #18 | Exceptional 10.5% |
| Immigrants | Scotland | 99.7 /100 | #19 | Exceptional 10.6% |
| Immigrants | North Macedonia | 99.7 /100 | #20 | Exceptional 10.6% |
| Luxembourgers | 99.7 /100 | #21 | Exceptional 10.6% |
| Eastern Europeans | 99.7 /100 | #22 | Exceptional 10.6% |
| Swedes | 99.7 /100 | #23 | Exceptional 10.6% |