Immigrants from Italy vs Inupiat Bachelor's Degree
COMPARE
Immigrants from Italy
Inupiat
Bachelor's Degree
Bachelor's Degree Comparison
Immigrants from Italy
Inupiat
41.3%
BACHELOR'S DEGREE
97.8/ 100
METRIC RATING
102nd/ 347
METRIC RANK
25.8%
BACHELOR'S DEGREE
0.0/ 100
METRIC RATING
337th/ 347
METRIC RANK
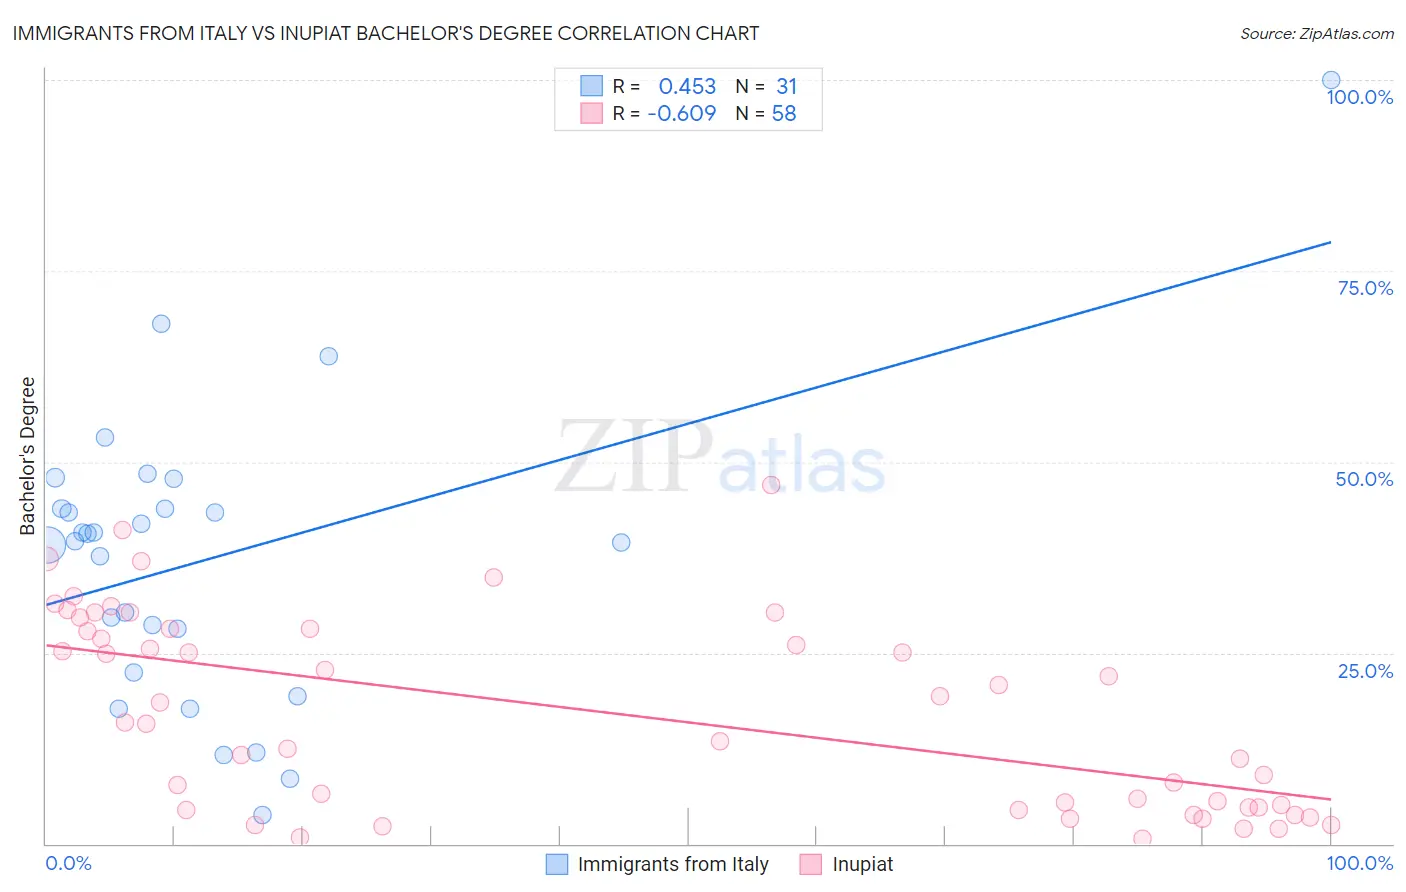
Immigrants from Italy vs Inupiat Bachelor's Degree Correlation Chart
The statistical analysis conducted on geographies consisting of 324,223,124 people shows a moderate positive correlation between the proportion of Immigrants from Italy and percentage of population with at least bachelor's degree education in the United States with a correlation coefficient (R) of 0.453 and weighted average of 41.3%. Similarly, the statistical analysis conducted on geographies consisting of 96,347,168 people shows a significant negative correlation between the proportion of Inupiat and percentage of population with at least bachelor's degree education in the United States with a correlation coefficient (R) of -0.609 and weighted average of 25.8%, a difference of 60.1%.
Bachelor's Degree Correlation Summary
| Measurement | Immigrants from Italy | Inupiat |
| Minimum | 3.7% | 0.66% |
| Maximum | 100.0% | 47.0% |
| Range | 96.3% | 46.4% |
| Mean | 37.2% | 17.1% |
| Median | 39.6% | 15.8% |
| Interquartile 25% (IQ1) | 22.5% | 4.7% |
| Interquartile 75% (IQ3) | 43.9% | 28.1% |
| Interquartile Range (IQR) | 21.5% | 23.4% |
| Standard Deviation (Sample) | 19.4% | 12.7% |
| Standard Deviation (Population) | 19.1% | 12.6% |
Similar Demographics by Bachelor's Degree
Demographics Similar to Immigrants from Italy by Bachelor's Degree
In terms of bachelor's degree, the demographic groups most similar to Immigrants from Italy are Immigrants from Morocco (41.4%, a difference of 0.26%), Macedonian (41.4%, a difference of 0.29%), Immigrants from England (41.4%, a difference of 0.32%), Chilean (41.2%, a difference of 0.34%), and Jordanian (41.2%, a difference of 0.40%).
| Demographics | Rating | Rank | Bachelor's Degree |
| Immigrants | North America | 98.5 /100 | #95 | Exceptional 41.7% |
| Immigrants | Moldova | 98.4 /100 | #96 | Exceptional 41.6% |
| Romanians | 98.4 /100 | #97 | Exceptional 41.6% |
| Immigrants | Ukraine | 98.3 /100 | #98 | Exceptional 41.5% |
| Immigrants | England | 98.1 /100 | #99 | Exceptional 41.4% |
| Macedonians | 98.1 /100 | #100 | Exceptional 41.4% |
| Immigrants | Morocco | 98.0 /100 | #101 | Exceptional 41.4% |
| Immigrants | Italy | 97.8 /100 | #102 | Exceptional 41.3% |
| Chileans | 97.5 /100 | #103 | Exceptional 41.2% |
| Jordanians | 97.4 /100 | #104 | Exceptional 41.2% |
| Syrians | 97.4 /100 | #105 | Exceptional 41.1% |
| Alsatians | 97.0 /100 | #106 | Exceptional 41.0% |
| Northern Europeans | 96.8 /100 | #107 | Exceptional 41.0% |
| Ukrainians | 96.6 /100 | #108 | Exceptional 40.9% |
| Arabs | 96.6 /100 | #109 | Exceptional 40.9% |
Demographics Similar to Inupiat by Bachelor's Degree
In terms of bachelor's degree, the demographic groups most similar to Inupiat are Pueblo (25.5%, a difference of 1.1%), Immigrants from Mexico (26.1%, a difference of 1.3%), Native/Alaskan (26.3%, a difference of 2.0%), Hopi (25.3%, a difference of 2.0%), and Arapaho (26.6%, a difference of 3.2%).
| Demographics | Rating | Rank | Bachelor's Degree |
| Spanish American Indians | 0.0 /100 | #330 | Tragic 27.5% |
| Immigrants | Azores | 0.0 /100 | #331 | Tragic 27.3% |
| Menominee | 0.0 /100 | #332 | Tragic 27.3% |
| Mexicans | 0.0 /100 | #333 | Tragic 27.1% |
| Arapaho | 0.0 /100 | #334 | Tragic 26.6% |
| Natives/Alaskans | 0.0 /100 | #335 | Tragic 26.3% |
| Immigrants | Mexico | 0.0 /100 | #336 | Tragic 26.1% |
| Inupiat | 0.0 /100 | #337 | Tragic 25.8% |
| Pueblo | 0.0 /100 | #338 | Tragic 25.5% |
| Hopi | 0.0 /100 | #339 | Tragic 25.3% |
| Lumbee | 0.0 /100 | #340 | Tragic 24.8% |
| Yuman | 0.0 /100 | #341 | Tragic 24.5% |
| Yakama | 0.0 /100 | #342 | Tragic 24.5% |
| Tohono O'odham | 0.0 /100 | #343 | Tragic 24.4% |
| Navajo | 0.0 /100 | #344 | Tragic 23.6% |