U.S. Virgin Islander vs Puget Sound Salish Child Poverty Among Girls Under 16
COMPARE
U.S. Virgin Islander
Puget Sound Salish
Child Poverty Among Girls Under 16
Child Poverty Among Girls Under 16 Comparison
U.S. Virgin Islanders
Puget Sound Salish
22.1%
CHILD POVERTY AMONG GIRLS UNDER 16
0.0/ 100
METRIC RATING
319th/ 347
METRIC RANK
15.4%
CHILD POVERTY AMONG GIRLS UNDER 16
90.1/ 100
METRIC RATING
130th/ 347
METRIC RANK
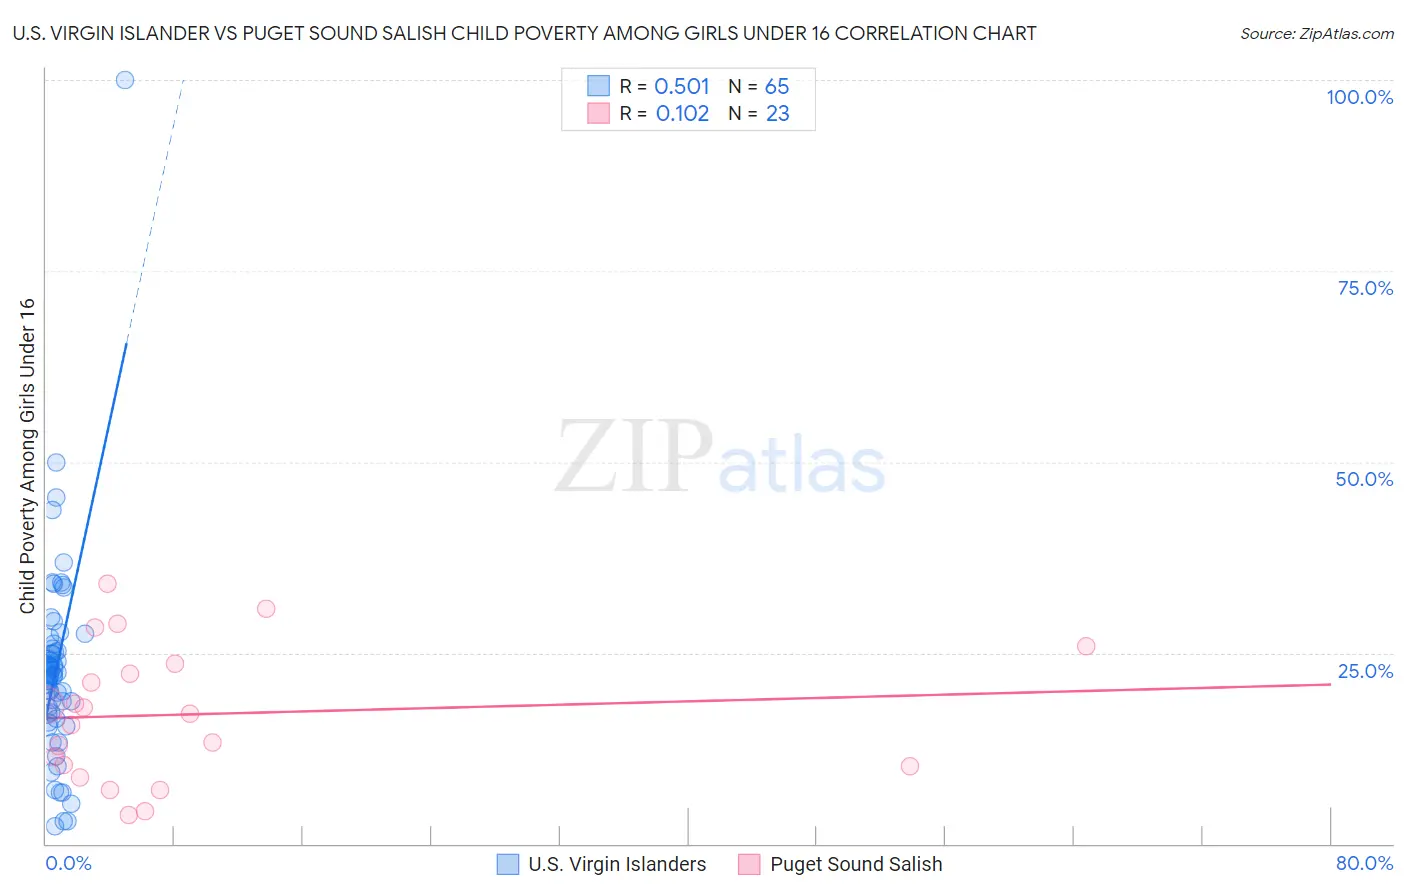
U.S. Virgin Islander vs Puget Sound Salish Child Poverty Among Girls Under 16 Correlation Chart
The statistical analysis conducted on geographies consisting of 87,265,744 people shows a substantial positive correlation between the proportion of U.S. Virgin Islanders and poverty level among girls under the age of 16 in the United States with a correlation coefficient (R) of 0.501 and weighted average of 22.1%. Similarly, the statistical analysis conducted on geographies consisting of 45,926,658 people shows a poor positive correlation between the proportion of Puget Sound Salish and poverty level among girls under the age of 16 in the United States with a correlation coefficient (R) of 0.102 and weighted average of 15.4%, a difference of 43.3%.
Child Poverty Among Girls Under 16 Correlation Summary
| Measurement | U.S. Virgin Islander | Puget Sound Salish |
| Minimum | 2.3% | 3.7% |
| Maximum | 100.0% | 34.1% |
| Range | 97.7% | 30.4% |
| Mean | 22.9% | 17.0% |
| Median | 22.1% | 17.0% |
| Interquartile 25% (IQ1) | 16.7% | 10.2% |
| Interquartile 75% (IQ3) | 25.9% | 23.5% |
| Interquartile Range (IQR) | 9.2% | 13.3% |
| Standard Deviation (Sample) | 13.7% | 8.7% |
| Standard Deviation (Population) | 13.6% | 8.5% |
Similar Demographics by Child Poverty Among Girls Under 16
Demographics Similar to U.S. Virgin Islanders by Child Poverty Among Girls Under 16
In terms of child poverty among girls under 16, the demographic groups most similar to U.S. Virgin Islanders are Immigrants from Dominica (22.1%, a difference of 0.16%), Honduran (22.2%, a difference of 0.60%), African (21.9%, a difference of 0.82%), Immigrants from Guatemala (21.9%, a difference of 1.1%), and Ute (21.8%, a difference of 1.4%).
| Demographics | Rating | Rank | Child Poverty Among Girls Under 16 |
| Immigrants | Mexico | 0.0 /100 | #312 | Tragic 21.6% |
| Creek | 0.0 /100 | #313 | Tragic 21.7% |
| Arapaho | 0.0 /100 | #314 | Tragic 21.7% |
| Ute | 0.0 /100 | #315 | Tragic 21.8% |
| Immigrants | Guatemala | 0.0 /100 | #316 | Tragic 21.9% |
| Africans | 0.0 /100 | #317 | Tragic 21.9% |
| Immigrants | Dominica | 0.0 /100 | #318 | Tragic 22.1% |
| U.S. Virgin Islanders | 0.0 /100 | #319 | Tragic 22.1% |
| Hondurans | 0.0 /100 | #320 | Tragic 22.2% |
| Colville | 0.0 /100 | #321 | Tragic 22.5% |
| Yakama | 0.0 /100 | #322 | Tragic 22.6% |
| Cajuns | 0.0 /100 | #323 | Tragic 22.6% |
| Paiute | 0.0 /100 | #324 | Tragic 22.6% |
| Immigrants | Congo | 0.0 /100 | #325 | Tragic 22.7% |
| Immigrants | Honduras | 0.0 /100 | #326 | Tragic 22.8% |
Demographics Similar to Puget Sound Salish by Child Poverty Among Girls Under 16
In terms of child poverty among girls under 16, the demographic groups most similar to Puget Sound Salish are Immigrants from Western Europe (15.4%, a difference of 0.020%), Mongolian (15.4%, a difference of 0.13%), Brazilian (15.4%, a difference of 0.15%), Immigrants from South Eastern Asia (15.4%, a difference of 0.16%), and Albanian (15.4%, a difference of 0.17%).
| Demographics | Rating | Rank | Child Poverty Among Girls Under 16 |
| Irish | 91.5 /100 | #123 | Exceptional 15.3% |
| Carpatho Rusyns | 91.4 /100 | #124 | Exceptional 15.3% |
| Peruvians | 91.2 /100 | #125 | Exceptional 15.4% |
| Scottish | 91.0 /100 | #126 | Exceptional 15.4% |
| Immigrants | Norway | 90.8 /100 | #127 | Exceptional 15.4% |
| Albanians | 90.5 /100 | #128 | Exceptional 15.4% |
| Immigrants | South Eastern Asia | 90.5 /100 | #129 | Exceptional 15.4% |
| Puget Sound Salish | 90.1 /100 | #130 | Exceptional 15.4% |
| Immigrants | Western Europe | 90.0 /100 | #131 | Exceptional 15.4% |
| Mongolians | 89.7 /100 | #132 | Excellent 15.4% |
| Brazilians | 89.6 /100 | #133 | Excellent 15.4% |
| Immigrants | Spain | 89.1 /100 | #134 | Excellent 15.5% |
| Czechoslovakians | 89.0 /100 | #135 | Excellent 15.5% |
| Native Hawaiians | 89.0 /100 | #136 | Excellent 15.5% |
| South Africans | 88.7 /100 | #137 | Excellent 15.5% |