Immigrants from Hungary vs Puget Sound Salish Single Mother Poverty
COMPARE
Immigrants from Hungary
Puget Sound Salish
Single Mother Poverty
Single Mother Poverty Comparison
Immigrants from Hungary
Puget Sound Salish
28.9%
SINGLE MOTHER POVERTY
70.6/ 100
METRIC RATING
158th/ 347
METRIC RANK
29.1%
SINGLE MOTHER POVERTY
55.1/ 100
METRIC RATING
171st/ 347
METRIC RANK
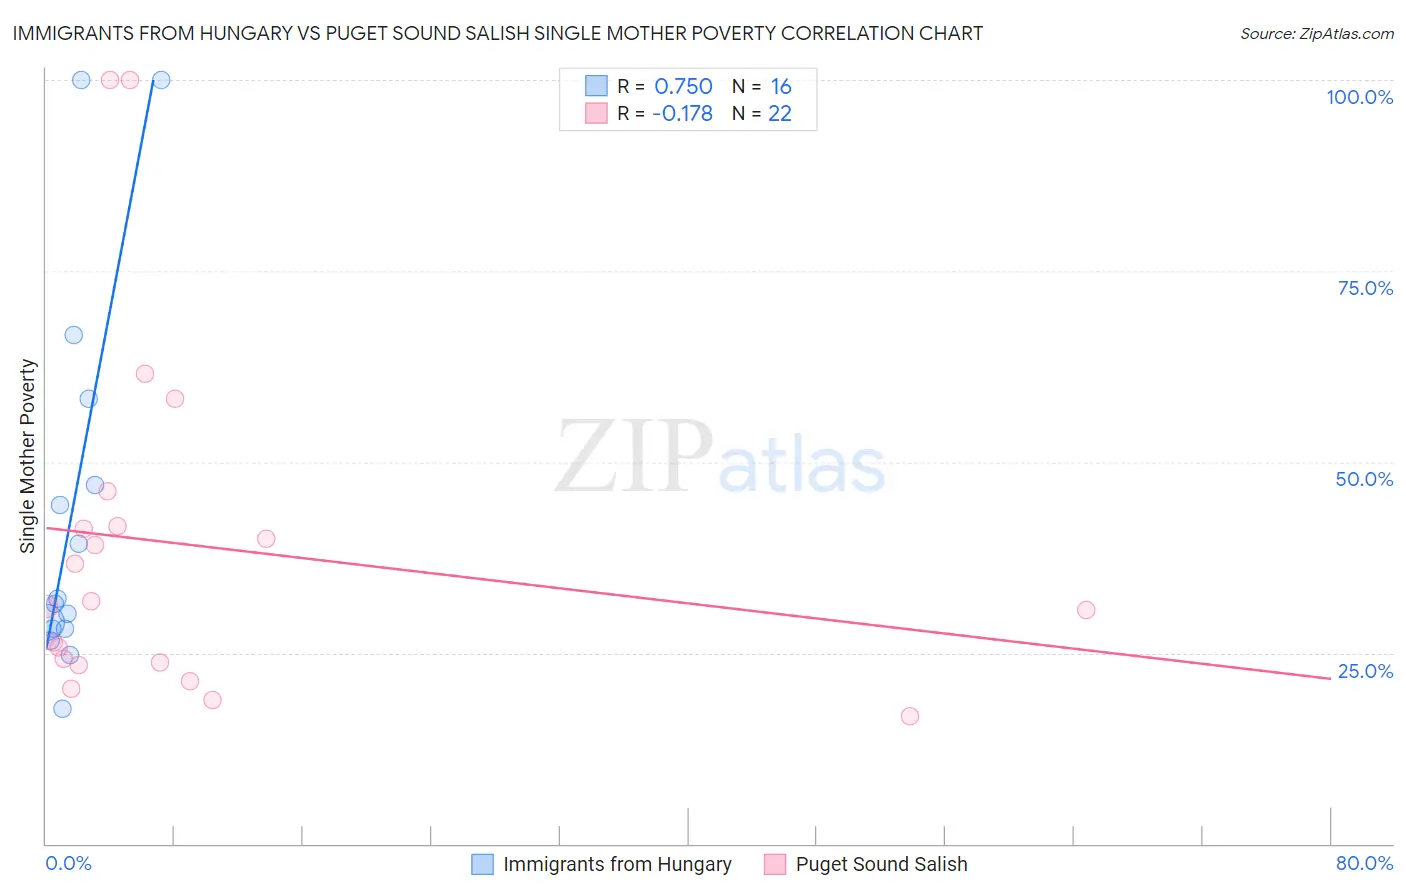
Immigrants from Hungary vs Puget Sound Salish Single Mother Poverty Correlation Chart
The statistical analysis conducted on geographies consisting of 192,269,766 people shows a strong positive correlation between the proportion of Immigrants from Hungary and poverty level among single mothers in the United States with a correlation coefficient (R) of 0.750 and weighted average of 28.9%. Similarly, the statistical analysis conducted on geographies consisting of 45,775,408 people shows a poor negative correlation between the proportion of Puget Sound Salish and poverty level among single mothers in the United States with a correlation coefficient (R) of -0.178 and weighted average of 29.1%, a difference of 0.81%.
Single Mother Poverty Correlation Summary
| Measurement | Immigrants from Hungary | Puget Sound Salish |
| Minimum | 17.7% | 16.7% |
| Maximum | 100.0% | 100.0% |
| Range | 82.3% | 83.3% |
| Mean | 44.0% | 39.0% |
| Median | 31.8% | 31.4% |
| Interquartile 25% (IQ1) | 28.1% | 23.7% |
| Interquartile 75% (IQ3) | 52.6% | 41.6% |
| Interquartile Range (IQR) | 24.5% | 17.9% |
| Standard Deviation (Sample) | 25.3% | 23.1% |
| Standard Deviation (Population) | 24.5% | 22.5% |
Demographics Similar to Immigrants from Hungary and Puget Sound Salish by Single Mother Poverty
In terms of single mother poverty, the demographic groups most similar to Immigrants from Hungary are Immigrants from Western Europe (28.9%, a difference of 0.030%), Iraqi (28.8%, a difference of 0.060%), Ugandan (28.8%, a difference of 0.070%), Czech (28.9%, a difference of 0.12%), and Japanese (28.9%, a difference of 0.15%). Similarly, the demographic groups most similar to Puget Sound Salish are New Zealander (29.1%, a difference of 0.0%), Carpatho Rusyn (29.1%, a difference of 0.060%), Immigrants from Uruguay (29.1%, a difference of 0.11%), European (29.1%, a difference of 0.12%), and Costa Rican (29.0%, a difference of 0.16%).
| Demographics | Rating | Rank | Single Mother Poverty |
| Portuguese | 73.2 /100 | #154 | Good 28.8% |
| Ugandans | 71.7 /100 | #155 | Good 28.8% |
| Iraqis | 71.5 /100 | #156 | Good 28.8% |
| Immigrants | Western Europe | 71.1 /100 | #157 | Good 28.9% |
| Immigrants | Hungary | 70.6 /100 | #158 | Good 28.9% |
| Czechs | 68.4 /100 | #159 | Good 28.9% |
| Japanese | 68.0 /100 | #160 | Good 28.9% |
| Immigrants | Cambodia | 66.6 /100 | #161 | Good 28.9% |
| Scandinavians | 66.2 /100 | #162 | Good 28.9% |
| Immigrants | Nigeria | 65.9 /100 | #163 | Good 28.9% |
| Immigrants | Kenya | 65.9 /100 | #164 | Good 28.9% |
| Arabs | 60.7 /100 | #165 | Good 29.0% |
| Inupiat | 60.4 /100 | #166 | Good 29.0% |
| Costa Ricans | 58.4 /100 | #167 | Average 29.0% |
| Europeans | 57.6 /100 | #168 | Average 29.1% |
| Immigrants | Uruguay | 57.2 /100 | #169 | Average 29.1% |
| New Zealanders | 55.1 /100 | #170 | Average 29.1% |
| Puget Sound Salish | 55.1 /100 | #171 | Average 29.1% |
| Carpatho Rusyns | 53.8 /100 | #172 | Average 29.1% |
| British | 50.6 /100 | #173 | Average 29.2% |
| Immigrants | Saudi Arabia | 50.0 /100 | #174 | Average 29.2% |