Immigrants from Hungary vs Puget Sound Salish Family Households with Children
COMPARE
Immigrants from Hungary
Puget Sound Salish
Family Households with Children
Family Households with Children Comparison
Immigrants from Hungary
Puget Sound Salish
26.7%
FAMILY HOUSEHOLDS WITH CHILDREN
0.6/ 100
METRIC RATING
273rd/ 347
METRIC RANK
27.4%
FAMILY HOUSEHOLDS WITH CHILDREN
46.2/ 100
METRIC RATING
182nd/ 347
METRIC RANK
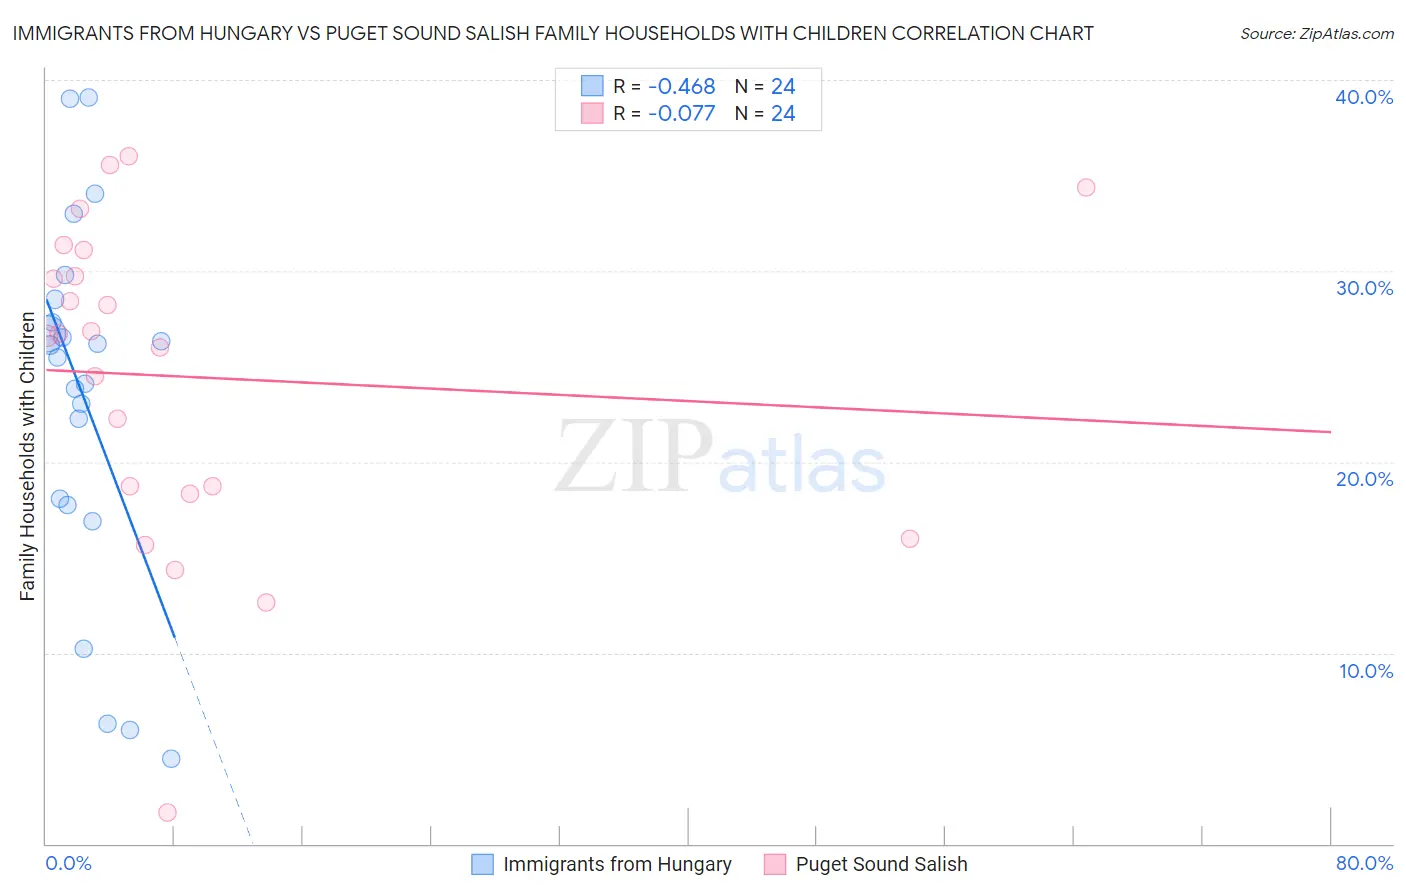
Immigrants from Hungary vs Puget Sound Salish Family Households with Children Correlation Chart
The statistical analysis conducted on geographies consisting of 195,566,845 people shows a moderate negative correlation between the proportion of Immigrants from Hungary and percentage of family households with children in the United States with a correlation coefficient (R) of -0.468 and weighted average of 26.7%. Similarly, the statistical analysis conducted on geographies consisting of 46,155,538 people shows a slight negative correlation between the proportion of Puget Sound Salish and percentage of family households with children in the United States with a correlation coefficient (R) of -0.077 and weighted average of 27.4%, a difference of 2.8%.
Family Households with Children Correlation Summary
| Measurement | Immigrants from Hungary | Puget Sound Salish |
| Minimum | 4.4% | 1.6% |
| Maximum | 39.1% | 36.0% |
| Range | 34.7% | 34.3% |
| Mean | 23.4% | 24.4% |
| Median | 25.8% | 26.7% |
| Interquartile 25% (IQ1) | 17.9% | 18.5% |
| Interquartile 75% (IQ3) | 27.9% | 30.4% |
| Interquartile Range (IQR) | 10.0% | 11.9% |
| Standard Deviation (Sample) | 9.5% | 8.5% |
| Standard Deviation (Population) | 9.3% | 8.3% |
Similar Demographics by Family Households with Children
Demographics Similar to Immigrants from Hungary by Family Households with Children
In terms of family households with children, the demographic groups most similar to Immigrants from Hungary are Eastern European (26.7%, a difference of 0.0%), Somali (26.7%, a difference of 0.030%), Immigrants from Northern Europe (26.7%, a difference of 0.090%), French (26.7%, a difference of 0.10%), and Immigrants from Zaire (26.7%, a difference of 0.11%).
| Demographics | Rating | Rank | Family Households with Children |
| Maltese | 0.9 /100 | #266 | Tragic 26.7% |
| Immigrants | Uzbekistan | 0.9 /100 | #267 | Tragic 26.7% |
| Immigrants | Belgium | 0.9 /100 | #268 | Tragic 26.7% |
| Immigrants | Denmark | 0.8 /100 | #269 | Tragic 26.7% |
| Immigrants | Zaire | 0.7 /100 | #270 | Tragic 26.7% |
| French | 0.7 /100 | #271 | Tragic 26.7% |
| Somalis | 0.7 /100 | #272 | Tragic 26.7% |
| Immigrants | Hungary | 0.6 /100 | #273 | Tragic 26.7% |
| Eastern Europeans | 0.6 /100 | #274 | Tragic 26.7% |
| Immigrants | Northern Europe | 0.5 /100 | #275 | Tragic 26.7% |
| Immigrants | Spain | 0.5 /100 | #276 | Tragic 26.6% |
| Celtics | 0.4 /100 | #277 | Tragic 26.6% |
| Immigrants | Europe | 0.4 /100 | #278 | Tragic 26.6% |
| Finns | 0.4 /100 | #279 | Tragic 26.6% |
| Senegalese | 0.4 /100 | #280 | Tragic 26.6% |
Demographics Similar to Puget Sound Salish by Family Households with Children
In terms of family households with children, the demographic groups most similar to Puget Sound Salish are Immigrants from Turkey (27.4%, a difference of 0.010%), Aleut (27.4%, a difference of 0.010%), Turkish (27.4%, a difference of 0.020%), South African (27.4%, a difference of 0.030%), and Native Hawaiian (27.4%, a difference of 0.040%).
| Demographics | Rating | Rank | Family Households with Children |
| British | 49.9 /100 | #175 | Average 27.4% |
| Immigrants | China | 49.6 /100 | #176 | Average 27.4% |
| Ugandans | 49.2 /100 | #177 | Average 27.4% |
| Spanish Americans | 48.9 /100 | #178 | Average 27.4% |
| Turks | 46.9 /100 | #179 | Average 27.4% |
| Immigrants | Turkey | 46.9 /100 | #180 | Average 27.4% |
| Aleuts | 46.7 /100 | #181 | Average 27.4% |
| Puget Sound Salish | 46.2 /100 | #182 | Average 27.4% |
| South Africans | 44.9 /100 | #183 | Average 27.4% |
| Native Hawaiians | 44.6 /100 | #184 | Average 27.4% |
| Delaware | 42.0 /100 | #185 | Average 27.4% |
| Immigrants | Brazil | 40.6 /100 | #186 | Average 27.4% |
| Creek | 39.8 /100 | #187 | Fair 27.4% |
| Dutch | 38.8 /100 | #188 | Fair 27.4% |
| Immigrants | Israel | 37.9 /100 | #189 | Fair 27.4% |