Immigrants from Hong Kong vs Sioux Single Female Poverty
COMPARE
Immigrants from Hong Kong
Sioux
Single Female Poverty
Single Female Poverty Comparison
Immigrants from Hong Kong
Sioux
16.5%
SINGLE FEMALE POVERTY
100.0/ 100
METRIC RATING
3rd/ 347
METRIC RANK
31.3%
SINGLE FEMALE POVERTY
0.0/ 100
METRIC RATING
341st/ 347
METRIC RANK
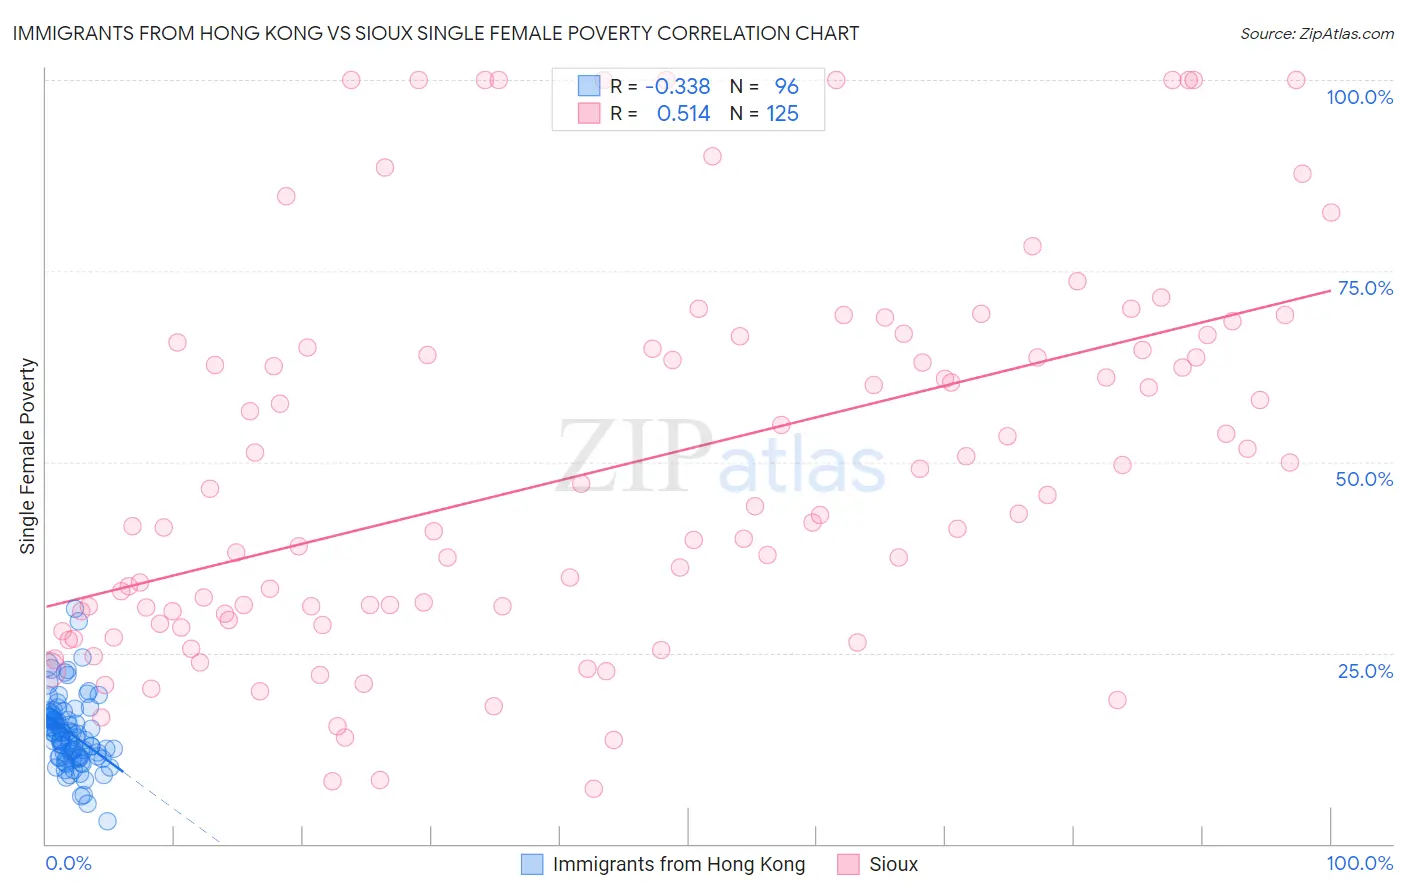
Immigrants from Hong Kong vs Sioux Single Female Poverty Correlation Chart
The statistical analysis conducted on geographies consisting of 250,865,263 people shows a mild negative correlation between the proportion of Immigrants from Hong Kong and poverty level among single females in the United States with a correlation coefficient (R) of -0.338 and weighted average of 16.5%. Similarly, the statistical analysis conducted on geographies consisting of 232,047,098 people shows a substantial positive correlation between the proportion of Sioux and poverty level among single females in the United States with a correlation coefficient (R) of 0.514 and weighted average of 31.3%, a difference of 89.1%.
Single Female Poverty Correlation Summary
| Measurement | Immigrants from Hong Kong | Sioux |
| Minimum | 2.9% | 7.1% |
| Maximum | 30.8% | 100.0% |
| Range | 27.8% | 92.9% |
| Mean | 14.5% | 49.1% |
| Median | 14.1% | 43.3% |
| Interquartile 25% (IQ1) | 11.3% | 29.7% |
| Interquartile 75% (IQ3) | 16.7% | 64.9% |
| Interquartile Range (IQR) | 5.3% | 35.2% |
| Standard Deviation (Sample) | 4.6% | 24.8% |
| Standard Deviation (Population) | 4.6% | 24.7% |
Similar Demographics by Single Female Poverty
Demographics Similar to Immigrants from Hong Kong by Single Female Poverty
In terms of single female poverty, the demographic groups most similar to Immigrants from Hong Kong are Immigrants from Taiwan (16.4%, a difference of 1.1%), Immigrants from India (16.8%, a difference of 1.7%), Chinese (16.1%, a difference of 2.4%), Assyrian/Chaldean/Syriac (17.0%, a difference of 2.6%), and Filipino (17.0%, a difference of 2.8%).
| Demographics | Rating | Rank | Single Female Poverty |
| Chinese | 100.0 /100 | #1 | Exceptional 16.1% |
| Immigrants | Taiwan | 100.0 /100 | #2 | Exceptional 16.4% |
| Immigrants | Hong Kong | 100.0 /100 | #3 | Exceptional 16.5% |
| Immigrants | India | 100.0 /100 | #4 | Exceptional 16.8% |
| Assyrians/Chaldeans/Syriacs | 100.0 /100 | #5 | Exceptional 17.0% |
| Filipinos | 100.0 /100 | #6 | Exceptional 17.0% |
| Thais | 100.0 /100 | #7 | Exceptional 17.3% |
| Immigrants | Iran | 100.0 /100 | #8 | Exceptional 17.5% |
| Bhutanese | 100.0 /100 | #9 | Exceptional 17.7% |
| Immigrants | Ireland | 100.0 /100 | #10 | Exceptional 17.8% |
| Immigrants | Lithuania | 100.0 /100 | #11 | Exceptional 17.8% |
| Immigrants | South Central Asia | 100.0 /100 | #12 | Exceptional 17.8% |
| Immigrants | Bolivia | 100.0 /100 | #13 | Exceptional 17.8% |
| Bolivians | 100.0 /100 | #14 | Exceptional 17.9% |
| Indians (Asian) | 100.0 /100 | #15 | Exceptional 17.9% |
Demographics Similar to Sioux by Single Female Poverty
In terms of single female poverty, the demographic groups most similar to Sioux are Navajo (31.7%, a difference of 1.3%), Cajun (30.6%, a difference of 2.0%), Cheyenne (30.4%, a difference of 2.8%), Pima (30.3%, a difference of 3.0%), and Crow (32.4%, a difference of 3.7%).
| Demographics | Rating | Rank | Single Female Poverty |
| Ute | 0.0 /100 | #333 | Tragic 28.4% |
| Pueblo | 0.0 /100 | #334 | Tragic 28.6% |
| Immigrants | Yemen | 0.0 /100 | #335 | Tragic 28.9% |
| Colville | 0.0 /100 | #336 | Tragic 29.1% |
| Yuman | 0.0 /100 | #337 | Tragic 29.4% |
| Pima | 0.0 /100 | #338 | Tragic 30.3% |
| Cheyenne | 0.0 /100 | #339 | Tragic 30.4% |
| Cajuns | 0.0 /100 | #340 | Tragic 30.6% |
| Sioux | 0.0 /100 | #341 | Tragic 31.3% |
| Navajo | 0.0 /100 | #342 | Tragic 31.7% |
| Crow | 0.0 /100 | #343 | Tragic 32.4% |
| Lumbee | 0.0 /100 | #344 | Tragic 33.0% |
| Houma | 0.0 /100 | #345 | Tragic 33.8% |
| Puerto Ricans | 0.0 /100 | #346 | Tragic 34.1% |
| Tohono O'odham | 0.0 /100 | #347 | Tragic 34.2% |