Immigrants from Hong Kong vs Immigrants from Senegal Single Female Poverty
COMPARE
Immigrants from Hong Kong
Immigrants from Senegal
Single Female Poverty
Single Female Poverty Comparison
Immigrants from Hong Kong
Immigrants from Senegal
16.5%
SINGLE FEMALE POVERTY
100.0/ 100
METRIC RATING
3rd/ 347
METRIC RANK
23.2%
SINGLE FEMALE POVERTY
0.1/ 100
METRIC RATING
272nd/ 347
METRIC RANK
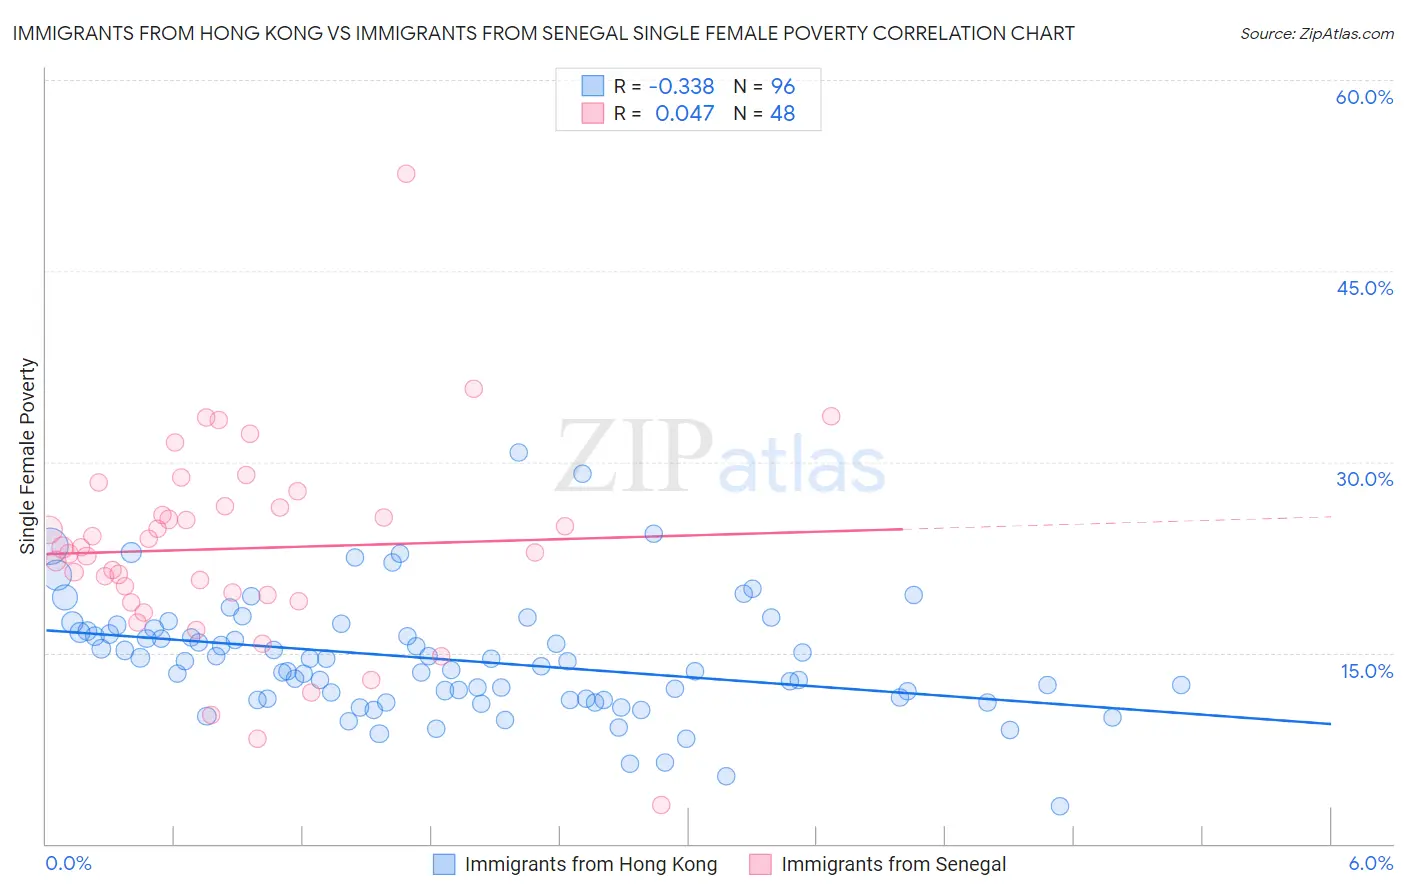
Immigrants from Hong Kong vs Immigrants from Senegal Single Female Poverty Correlation Chart
The statistical analysis conducted on geographies consisting of 250,865,263 people shows a mild negative correlation between the proportion of Immigrants from Hong Kong and poverty level among single females in the United States with a correlation coefficient (R) of -0.338 and weighted average of 16.5%. Similarly, the statistical analysis conducted on geographies consisting of 89,958,915 people shows no correlation between the proportion of Immigrants from Senegal and poverty level among single females in the United States with a correlation coefficient (R) of 0.047 and weighted average of 23.2%, a difference of 40.6%.
Single Female Poverty Correlation Summary
| Measurement | Immigrants from Hong Kong | Immigrants from Senegal |
| Minimum | 2.9% | 3.0% |
| Maximum | 30.8% | 52.6% |
| Range | 27.8% | 49.6% |
| Mean | 14.5% | 23.2% |
| Median | 14.1% | 23.1% |
| Interquartile 25% (IQ1) | 11.3% | 19.3% |
| Interquartile 75% (IQ3) | 16.7% | 26.4% |
| Interquartile Range (IQR) | 5.3% | 7.1% |
| Standard Deviation (Sample) | 4.6% | 8.0% |
| Standard Deviation (Population) | 4.6% | 7.9% |
Similar Demographics by Single Female Poverty
Demographics Similar to Immigrants from Hong Kong by Single Female Poverty
In terms of single female poverty, the demographic groups most similar to Immigrants from Hong Kong are Immigrants from Taiwan (16.4%, a difference of 1.1%), Immigrants from India (16.8%, a difference of 1.7%), Chinese (16.1%, a difference of 2.4%), Assyrian/Chaldean/Syriac (17.0%, a difference of 2.6%), and Filipino (17.0%, a difference of 2.8%).
| Demographics | Rating | Rank | Single Female Poverty |
| Chinese | 100.0 /100 | #1 | Exceptional 16.1% |
| Immigrants | Taiwan | 100.0 /100 | #2 | Exceptional 16.4% |
| Immigrants | Hong Kong | 100.0 /100 | #3 | Exceptional 16.5% |
| Immigrants | India | 100.0 /100 | #4 | Exceptional 16.8% |
| Assyrians/Chaldeans/Syriacs | 100.0 /100 | #5 | Exceptional 17.0% |
| Filipinos | 100.0 /100 | #6 | Exceptional 17.0% |
| Thais | 100.0 /100 | #7 | Exceptional 17.3% |
| Immigrants | Iran | 100.0 /100 | #8 | Exceptional 17.5% |
| Bhutanese | 100.0 /100 | #9 | Exceptional 17.7% |
| Immigrants | Ireland | 100.0 /100 | #10 | Exceptional 17.8% |
| Immigrants | Lithuania | 100.0 /100 | #11 | Exceptional 17.8% |
| Immigrants | South Central Asia | 100.0 /100 | #12 | Exceptional 17.8% |
| Immigrants | Bolivia | 100.0 /100 | #13 | Exceptional 17.8% |
| Bolivians | 100.0 /100 | #14 | Exceptional 17.9% |
| Indians (Asian) | 100.0 /100 | #15 | Exceptional 17.9% |
Demographics Similar to Immigrants from Senegal by Single Female Poverty
In terms of single female poverty, the demographic groups most similar to Immigrants from Senegal are Subsaharan African (23.2%, a difference of 0.19%), Alaska Native (23.3%, a difference of 0.25%), Marshallese (23.3%, a difference of 0.26%), Inupiat (23.1%, a difference of 0.43%), and Mexican American Indian (23.4%, a difference of 0.53%).
| Demographics | Rating | Rank | Single Female Poverty |
| Central Americans | 0.2 /100 | #265 | Tragic 23.0% |
| Immigrants | Micronesia | 0.2 /100 | #266 | Tragic 23.0% |
| Senegalese | 0.2 /100 | #267 | Tragic 23.0% |
| Fijians | 0.2 /100 | #268 | Tragic 23.1% |
| Hmong | 0.2 /100 | #269 | Tragic 23.1% |
| Inupiat | 0.2 /100 | #270 | Tragic 23.1% |
| Sub-Saharan Africans | 0.1 /100 | #271 | Tragic 23.2% |
| Immigrants | Senegal | 0.1 /100 | #272 | Tragic 23.2% |
| Alaska Natives | 0.1 /100 | #273 | Tragic 23.3% |
| Marshallese | 0.1 /100 | #274 | Tragic 23.3% |
| Mexican American Indians | 0.1 /100 | #275 | Tragic 23.4% |
| Immigrants | Azores | 0.0 /100 | #276 | Tragic 23.5% |
| Pennsylvania Germans | 0.0 /100 | #277 | Tragic 23.6% |
| Immigrants | Nonimmigrants | 0.0 /100 | #278 | Tragic 23.6% |
| Alaskan Athabascans | 0.0 /100 | #279 | Tragic 23.6% |