Immigrants from Honduras vs Immigrants from Cambodia Female Disability
COMPARE
Immigrants from Honduras
Immigrants from Cambodia
Female Disability
Female Disability Comparison
Immigrants from Honduras
Immigrants from Cambodia
12.3%
FEMALE DISABILITY
31.3/ 100
METRIC RATING
190th/ 347
METRIC RANK
12.5%
FEMALE DISABILITY
7.8/ 100
METRIC RATING
228th/ 347
METRIC RANK
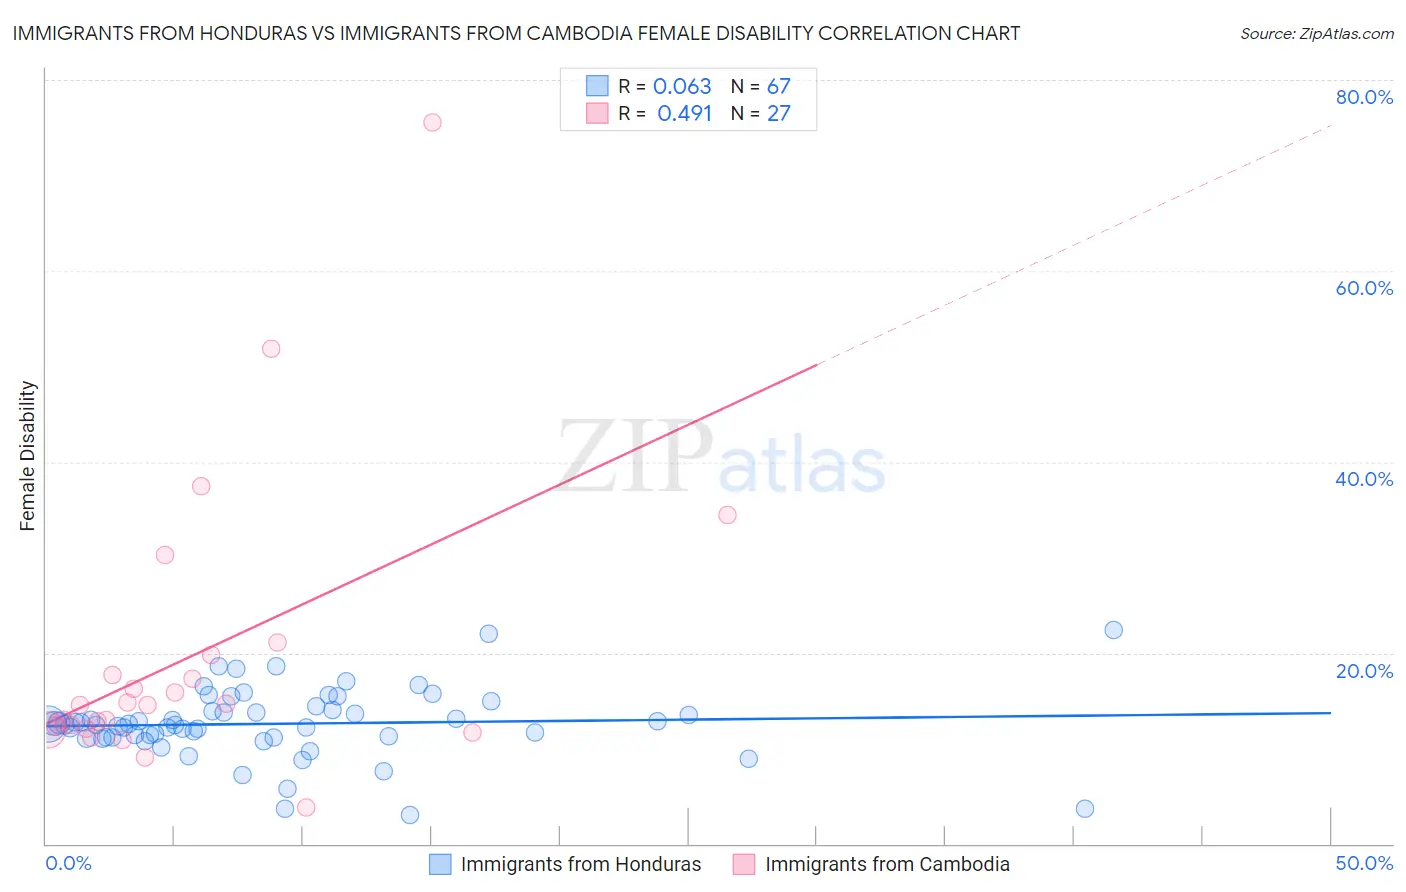
Immigrants from Honduras vs Immigrants from Cambodia Female Disability Correlation Chart
The statistical analysis conducted on geographies consisting of 322,542,549 people shows a slight positive correlation between the proportion of Immigrants from Honduras and percentage of females with a disability in the United States with a correlation coefficient (R) of 0.063 and weighted average of 12.3%. Similarly, the statistical analysis conducted on geographies consisting of 205,152,256 people shows a moderate positive correlation between the proportion of Immigrants from Cambodia and percentage of females with a disability in the United States with a correlation coefficient (R) of 0.491 and weighted average of 12.5%, a difference of 1.6%.
Female Disability Correlation Summary
| Measurement | Immigrants from Honduras | Immigrants from Cambodia |
| Minimum | 3.1% | 3.8% |
| Maximum | 22.4% | 75.5% |
| Range | 19.4% | 71.7% |
| Mean | 12.6% | 19.6% |
| Median | 12.5% | 14.5% |
| Interquartile 25% (IQ1) | 11.1% | 12.0% |
| Interquartile 75% (IQ3) | 14.0% | 19.8% |
| Interquartile Range (IQR) | 2.8% | 7.8% |
| Standard Deviation (Sample) | 3.6% | 15.0% |
| Standard Deviation (Population) | 3.6% | 14.8% |
Similar Demographics by Female Disability
Demographics Similar to Immigrants from Honduras by Female Disability
In terms of female disability, the demographic groups most similar to Immigrants from Honduras are Immigrants from Albania (12.3%, a difference of 0.010%), Immigrants from North America (12.3%, a difference of 0.060%), Armenian (12.3%, a difference of 0.070%), Serbian (12.3%, a difference of 0.080%), and Austrian (12.3%, a difference of 0.090%).
| Demographics | Rating | Rank | Female Disability |
| Cubans | 36.5 /100 | #183 | Fair 12.3% |
| Iraqis | 36.0 /100 | #184 | Fair 12.3% |
| Immigrants | Uzbekistan | 33.9 /100 | #185 | Fair 12.3% |
| Austrians | 33.3 /100 | #186 | Fair 12.3% |
| Serbians | 33.1 /100 | #187 | Fair 12.3% |
| Immigrants | North America | 32.8 /100 | #188 | Fair 12.3% |
| Immigrants | Albania | 31.6 /100 | #189 | Fair 12.3% |
| Immigrants | Honduras | 31.3 /100 | #190 | Fair 12.3% |
| Armenians | 29.7 /100 | #191 | Fair 12.3% |
| Immigrants | Western Africa | 29.2 /100 | #192 | Fair 12.3% |
| Northern Europeans | 27.5 /100 | #193 | Fair 12.3% |
| Ukrainians | 27.2 /100 | #194 | Fair 12.3% |
| Swedes | 26.6 /100 | #195 | Fair 12.3% |
| Immigrants | Panama | 25.5 /100 | #196 | Fair 12.3% |
| Hondurans | 25.4 /100 | #197 | Fair 12.3% |
Demographics Similar to Immigrants from Cambodia by Female Disability
In terms of female disability, the demographic groups most similar to Immigrants from Cambodia are Hispanic or Latino (12.5%, a difference of 0.030%), Assyrian/Chaldean/Syriac (12.5%, a difference of 0.030%), Hungarian (12.5%, a difference of 0.070%), Polish (12.5%, a difference of 0.080%), and Immigrants from Belize (12.5%, a difference of 0.11%).
| Demographics | Rating | Rank | Female Disability |
| Native Hawaiians | 10.8 /100 | #221 | Poor 12.4% |
| Italians | 10.7 /100 | #222 | Poor 12.4% |
| Guamanians/Chamorros | 9.5 /100 | #223 | Tragic 12.5% |
| Belizeans | 9.3 /100 | #224 | Tragic 12.5% |
| Poles | 8.4 /100 | #225 | Tragic 12.5% |
| Hispanics or Latinos | 8.0 /100 | #226 | Tragic 12.5% |
| Assyrians/Chaldeans/Syriacs | 8.0 /100 | #227 | Tragic 12.5% |
| Immigrants | Cambodia | 7.8 /100 | #228 | Tragic 12.5% |
| Hungarians | 7.2 /100 | #229 | Tragic 12.5% |
| Immigrants | Belize | 7.0 /100 | #230 | Tragic 12.5% |
| Belgians | 6.5 /100 | #231 | Tragic 12.5% |
| Immigrants | Somalia | 5.9 /100 | #232 | Tragic 12.5% |
| Immigrants | Iraq | 5.3 /100 | #233 | Tragic 12.5% |
| Scandinavians | 5.3 /100 | #234 | Tragic 12.5% |
| Malaysians | 5.0 /100 | #235 | Tragic 12.5% |