Immigrants from Eritrea vs Immigrants from Eastern Africa Female Poverty
COMPARE
Immigrants from Eritrea
Immigrants from Eastern Africa
Female Poverty
Female Poverty Comparison
Immigrants from Eritrea
Immigrants from Eastern Africa
14.6%
FEMALE POVERTY
2.4/ 100
METRIC RATING
226th/ 347
METRIC RANK
14.2%
FEMALE POVERTY
9.0/ 100
METRIC RATING
207th/ 347
METRIC RANK
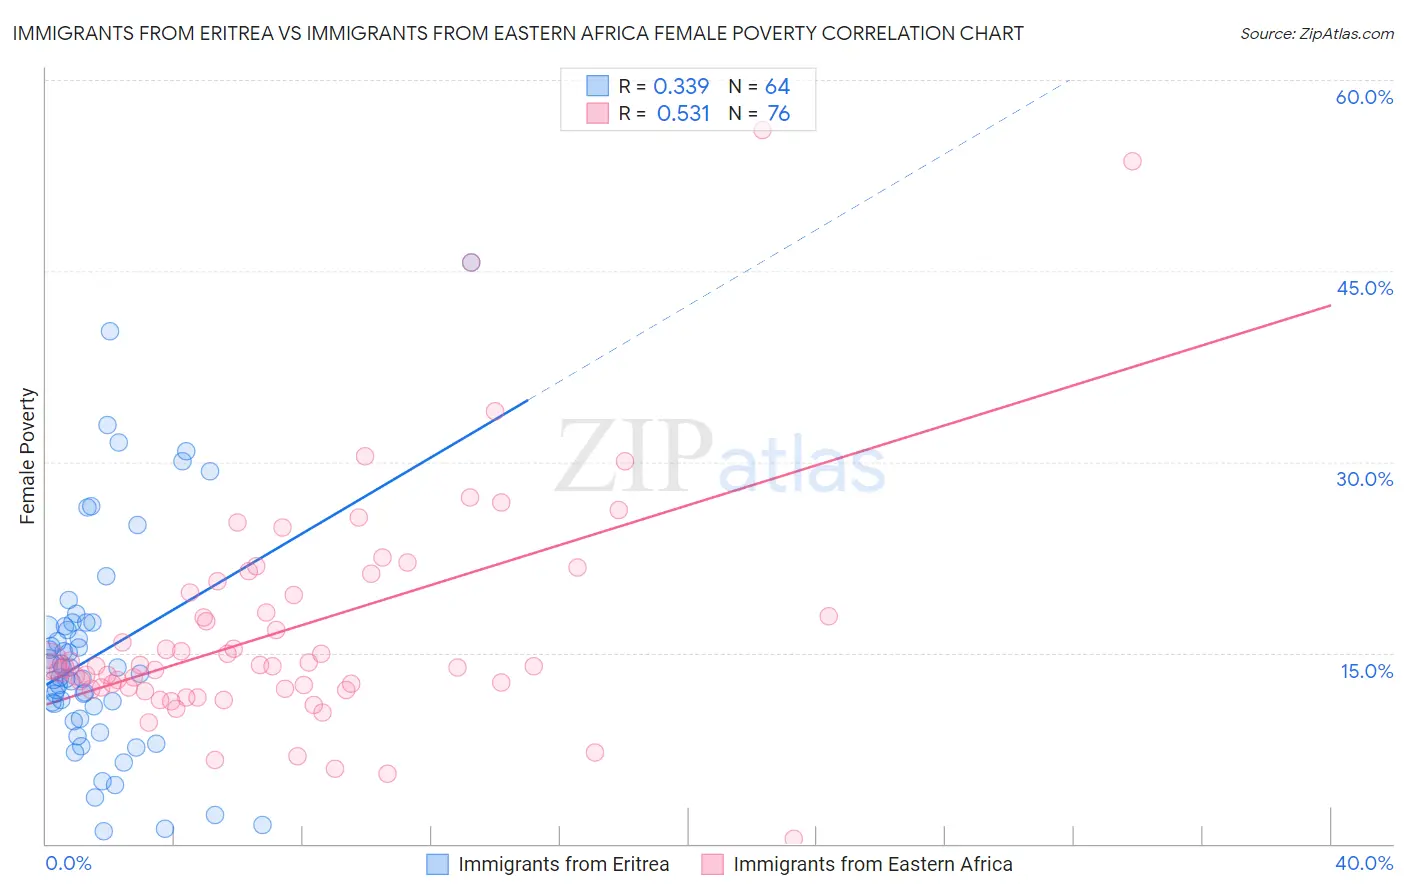
Immigrants from Eritrea vs Immigrants from Eastern Africa Female Poverty Correlation Chart
The statistical analysis conducted on geographies consisting of 104,846,826 people shows a mild positive correlation between the proportion of Immigrants from Eritrea and poverty level among females in the United States with a correlation coefficient (R) of 0.339 and weighted average of 14.6%. Similarly, the statistical analysis conducted on geographies consisting of 354,843,710 people shows a substantial positive correlation between the proportion of Immigrants from Eastern Africa and poverty level among females in the United States with a correlation coefficient (R) of 0.531 and weighted average of 14.2%, a difference of 3.2%.
Female Poverty Correlation Summary
| Measurement | Immigrants from Eritrea | Immigrants from Eastern Africa |
| Minimum | 1.0% | 0.38% |
| Maximum | 45.6% | 56.1% |
| Range | 44.6% | 55.7% |
| Mean | 15.0% | 17.0% |
| Median | 13.6% | 13.9% |
| Interquartile 25% (IQ1) | 10.3% | 12.2% |
| Interquartile 75% (IQ3) | 17.2% | 20.2% |
| Interquartile Range (IQR) | 6.9% | 8.0% |
| Standard Deviation (Sample) | 8.9% | 9.4% |
| Standard Deviation (Population) | 8.8% | 9.3% |
Demographics Similar to Immigrants from Eritrea and Immigrants from Eastern Africa by Female Poverty
In terms of female poverty, the demographic groups most similar to Immigrants from Eritrea are American (14.6%, a difference of 0.33%), Immigrants from Micronesia (14.6%, a difference of 0.33%), Immigrants from Africa (14.5%, a difference of 0.73%), Nonimmigrants (14.5%, a difference of 0.96%), and Immigrants from Cambodia (14.5%, a difference of 0.99%). Similarly, the demographic groups most similar to Immigrants from Eastern Africa are Immigrants from the Azores (14.2%, a difference of 0.34%), Panamanian (14.2%, a difference of 0.41%), Malaysian (14.3%, a difference of 0.49%), Moroccan (14.3%, a difference of 0.58%), and Immigrants from Uruguay (14.0%, a difference of 1.1%).
| Demographics | Rating | Rank | Female Poverty |
| Immigrants | Uruguay | 14.0 /100 | #206 | Poor 14.0% |
| Immigrants | Eastern Africa | 9.0 /100 | #207 | Tragic 14.2% |
| Immigrants | Azores | 7.9 /100 | #208 | Tragic 14.2% |
| Panamanians | 7.7 /100 | #209 | Tragic 14.2% |
| Malaysians | 7.4 /100 | #210 | Tragic 14.3% |
| Moroccans | 7.2 /100 | #211 | Tragic 14.3% |
| Bermudans | 5.5 /100 | #212 | Tragic 14.4% |
| Alaskan Athabascans | 5.3 /100 | #213 | Tragic 14.4% |
| Marshallese | 5.0 /100 | #214 | Tragic 14.4% |
| Immigrants | Panama | 4.7 /100 | #215 | Tragic 14.4% |
| Immigrants | Thailand | 4.5 /100 | #216 | Tragic 14.4% |
| Immigrants | Immigrants | 4.5 /100 | #217 | Tragic 14.4% |
| Immigrants | Uzbekistan | 4.4 /100 | #218 | Tragic 14.4% |
| Japanese | 4.1 /100 | #219 | Tragic 14.5% |
| Alsatians | 4.0 /100 | #220 | Tragic 14.5% |
| Immigrants | Cambodia | 3.7 /100 | #221 | Tragic 14.5% |
| Immigrants | Nonimmigrants | 3.7 /100 | #222 | Tragic 14.5% |
| Immigrants | Africa | 3.3 /100 | #223 | Tragic 14.5% |
| Americans | 2.8 /100 | #224 | Tragic 14.6% |
| Immigrants | Micronesia | 2.8 /100 | #225 | Tragic 14.6% |
| Immigrants | Eritrea | 2.4 /100 | #226 | Tragic 14.6% |