Immigrants from Eritrea vs Immigrants from Italy Female Poverty
COMPARE
Immigrants from Eritrea
Immigrants from Italy
Female Poverty
Female Poverty Comparison
Immigrants from Eritrea
Immigrants from Italy
14.6%
FEMALE POVERTY
2.4/ 100
METRIC RATING
226th/ 347
METRIC RANK
12.2%
FEMALE POVERTY
98.0/ 100
METRIC RATING
62nd/ 347
METRIC RANK
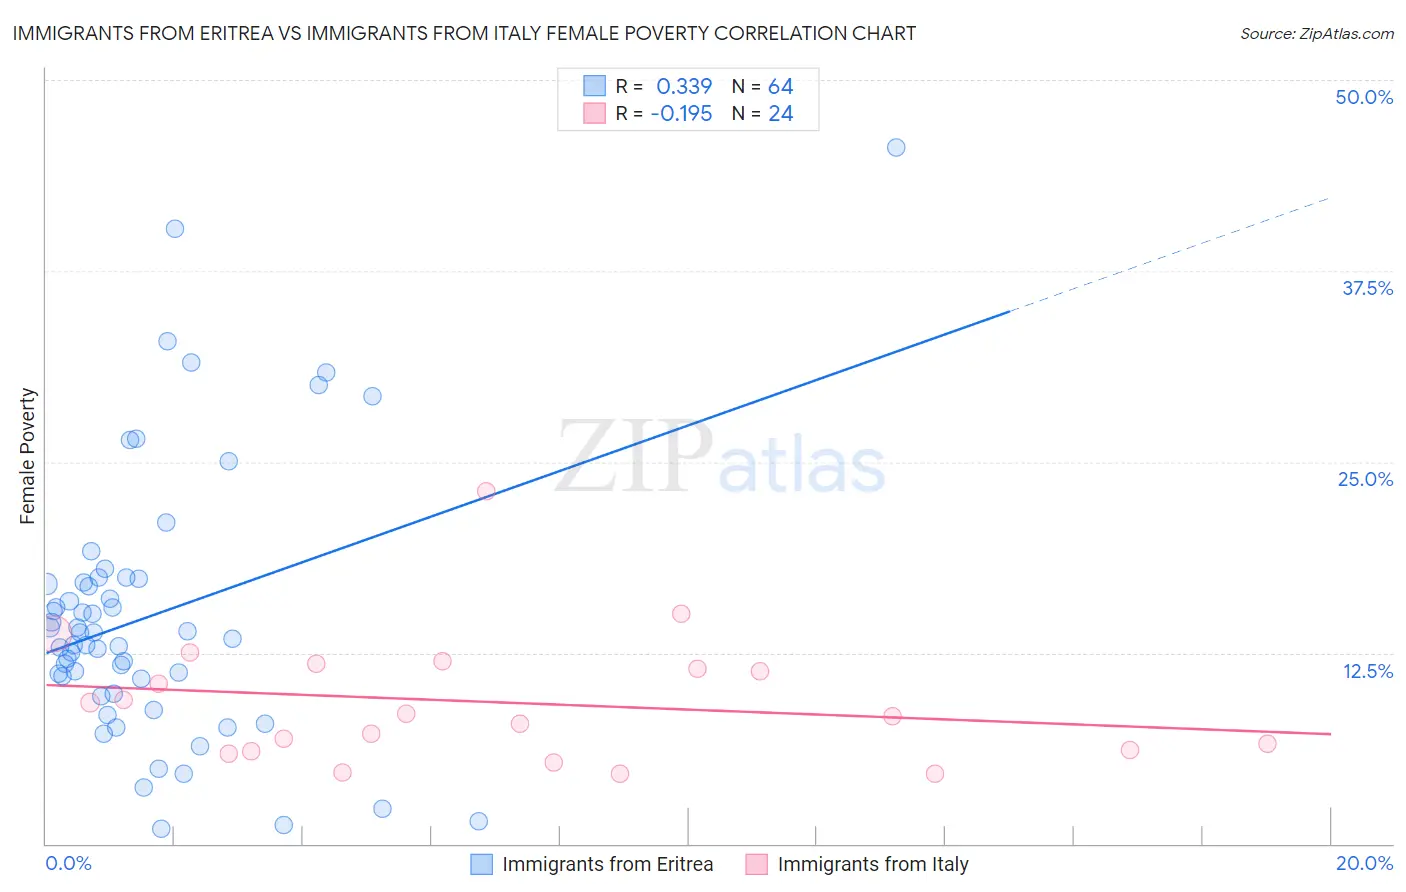
Immigrants from Eritrea vs Immigrants from Italy Female Poverty Correlation Chart
The statistical analysis conducted on geographies consisting of 104,846,826 people shows a mild positive correlation between the proportion of Immigrants from Eritrea and poverty level among females in the United States with a correlation coefficient (R) of 0.339 and weighted average of 14.6%. Similarly, the statistical analysis conducted on geographies consisting of 324,078,093 people shows a poor negative correlation between the proportion of Immigrants from Italy and poverty level among females in the United States with a correlation coefficient (R) of -0.195 and weighted average of 12.2%, a difference of 20.2%.
Female Poverty Correlation Summary
| Measurement | Immigrants from Eritrea | Immigrants from Italy |
| Minimum | 1.0% | 4.5% |
| Maximum | 45.6% | 23.1% |
| Range | 44.6% | 18.5% |
| Mean | 15.0% | 9.3% |
| Median | 13.6% | 8.4% |
| Interquartile 25% (IQ1) | 10.3% | 6.1% |
| Interquartile 75% (IQ3) | 17.2% | 11.6% |
| Interquartile Range (IQR) | 6.9% | 5.5% |
| Standard Deviation (Sample) | 8.9% | 4.2% |
| Standard Deviation (Population) | 8.8% | 4.1% |
Similar Demographics by Female Poverty
Demographics Similar to Immigrants from Eritrea by Female Poverty
In terms of female poverty, the demographic groups most similar to Immigrants from Eritrea are Immigrants from Nigeria (14.7%, a difference of 0.31%), American (14.6%, a difference of 0.33%), Immigrants from Micronesia (14.6%, a difference of 0.33%), German Russian (14.7%, a difference of 0.45%), and Ghanaian (14.7%, a difference of 0.52%).
| Demographics | Rating | Rank | Female Poverty |
| Japanese | 4.1 /100 | #219 | Tragic 14.5% |
| Alsatians | 4.0 /100 | #220 | Tragic 14.5% |
| Immigrants | Cambodia | 3.7 /100 | #221 | Tragic 14.5% |
| Immigrants | Nonimmigrants | 3.7 /100 | #222 | Tragic 14.5% |
| Immigrants | Africa | 3.3 /100 | #223 | Tragic 14.5% |
| Americans | 2.8 /100 | #224 | Tragic 14.6% |
| Immigrants | Micronesia | 2.8 /100 | #225 | Tragic 14.6% |
| Immigrants | Eritrea | 2.4 /100 | #226 | Tragic 14.6% |
| Immigrants | Nigeria | 2.1 /100 | #227 | Tragic 14.7% |
| German Russians | 2.0 /100 | #228 | Tragic 14.7% |
| Ghanaians | 1.9 /100 | #229 | Tragic 14.7% |
| Alaska Natives | 1.8 /100 | #230 | Tragic 14.7% |
| Nigerians | 1.7 /100 | #231 | Tragic 14.8% |
| Osage | 1.5 /100 | #232 | Tragic 14.8% |
| Immigrants | Saudi Arabia | 1.4 /100 | #233 | Tragic 14.8% |
Demographics Similar to Immigrants from Italy by Female Poverty
In terms of female poverty, the demographic groups most similar to Immigrants from Italy are Immigrants from Asia (12.2%, a difference of 0.020%), Immigrants from Australia (12.2%, a difference of 0.030%), Ukrainian (12.2%, a difference of 0.080%), German (12.2%, a difference of 0.11%), and Indian (Asian) (12.2%, a difference of 0.14%).
| Demographics | Rating | Rank | Female Poverty |
| Immigrants | Sri Lanka | 98.5 /100 | #55 | Exceptional 12.1% |
| Estonians | 98.3 /100 | #56 | Exceptional 12.1% |
| Immigrants | Serbia | 98.3 /100 | #57 | Exceptional 12.1% |
| Scandinavians | 98.2 /100 | #58 | Exceptional 12.1% |
| Immigrants | Europe | 98.2 /100 | #59 | Exceptional 12.1% |
| Immigrants | Australia | 98.1 /100 | #60 | Exceptional 12.2% |
| Immigrants | Asia | 98.1 /100 | #61 | Exceptional 12.2% |
| Immigrants | Italy | 98.0 /100 | #62 | Exceptional 12.2% |
| Ukrainians | 98.0 /100 | #63 | Exceptional 12.2% |
| Germans | 98.0 /100 | #64 | Exceptional 12.2% |
| Indians (Asian) | 97.9 /100 | #65 | Exceptional 12.2% |
| Austrians | 97.9 /100 | #66 | Exceptional 12.2% |
| Immigrants | Eastern Asia | 97.8 /100 | #67 | Exceptional 12.2% |
| Immigrants | Netherlands | 97.8 /100 | #68 | Exceptional 12.2% |
| Swiss | 97.7 /100 | #69 | Exceptional 12.2% |