Immigrants from Eritrea vs Spanish American Indian Female Poverty
COMPARE
Immigrants from Eritrea
Spanish American Indian
Female Poverty
Female Poverty Comparison
Immigrants from Eritrea
Spanish American Indians
14.6%
FEMALE POVERTY
2.4/ 100
METRIC RATING
226th/ 347
METRIC RANK
15.3%
FEMALE POVERTY
0.3/ 100
METRIC RATING
245th/ 347
METRIC RANK
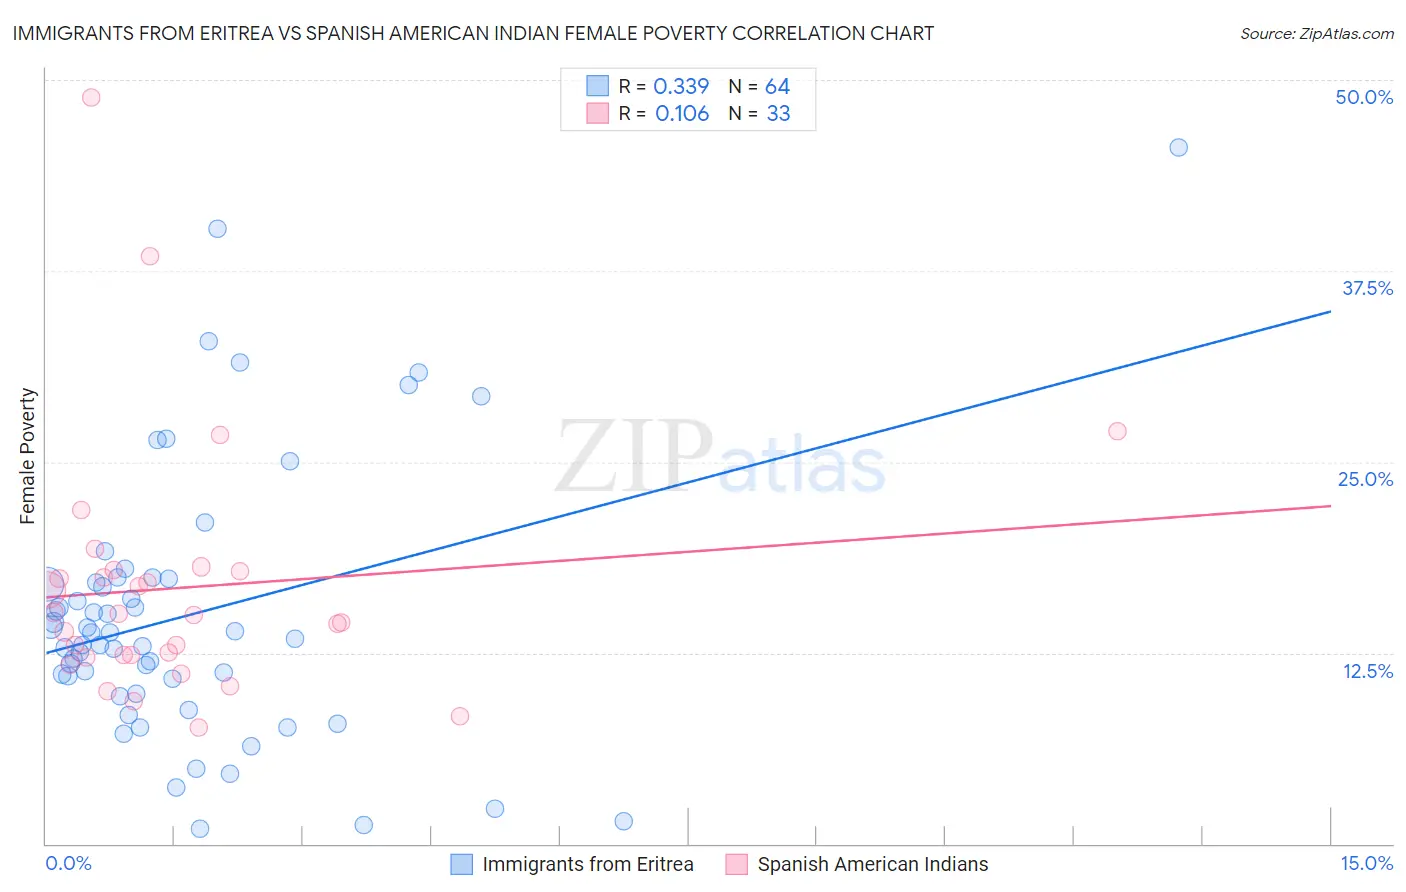
Immigrants from Eritrea vs Spanish American Indian Female Poverty Correlation Chart
The statistical analysis conducted on geographies consisting of 104,846,826 people shows a mild positive correlation between the proportion of Immigrants from Eritrea and poverty level among females in the United States with a correlation coefficient (R) of 0.339 and weighted average of 14.6%. Similarly, the statistical analysis conducted on geographies consisting of 73,136,112 people shows a poor positive correlation between the proportion of Spanish American Indians and poverty level among females in the United States with a correlation coefficient (R) of 0.106 and weighted average of 15.3%, a difference of 4.5%.
Female Poverty Correlation Summary
| Measurement | Immigrants from Eritrea | Spanish American Indian |
| Minimum | 1.0% | 7.6% |
| Maximum | 45.6% | 48.9% |
| Range | 44.6% | 41.2% |
| Mean | 15.0% | 16.8% |
| Median | 13.6% | 15.0% |
| Interquartile 25% (IQ1) | 10.3% | 12.3% |
| Interquartile 75% (IQ3) | 17.2% | 17.9% |
| Interquartile Range (IQR) | 6.9% | 5.6% |
| Standard Deviation (Sample) | 8.9% | 8.3% |
| Standard Deviation (Population) | 8.8% | 8.2% |
Demographics Similar to Immigrants from Eritrea and Spanish American Indians by Female Poverty
In terms of female poverty, the demographic groups most similar to Immigrants from Eritrea are Immigrants from Nigeria (14.7%, a difference of 0.31%), Immigrants from Micronesia (14.6%, a difference of 0.33%), German Russian (14.7%, a difference of 0.45%), Ghanaian (14.7%, a difference of 0.52%), and Alaska Native (14.7%, a difference of 0.72%). Similarly, the demographic groups most similar to Spanish American Indians are Ecuadorian (15.3%, a difference of 0.090%), Nicaraguan (15.3%, a difference of 0.15%), Nepalese (15.2%, a difference of 0.39%), Immigrants from Sudan (15.2%, a difference of 0.51%), and Sudanese (15.2%, a difference of 0.76%).
| Demographics | Rating | Rank | Female Poverty |
| Immigrants | Micronesia | 2.8 /100 | #225 | Tragic 14.6% |
| Immigrants | Eritrea | 2.4 /100 | #226 | Tragic 14.6% |
| Immigrants | Nigeria | 2.1 /100 | #227 | Tragic 14.7% |
| German Russians | 2.0 /100 | #228 | Tragic 14.7% |
| Ghanaians | 1.9 /100 | #229 | Tragic 14.7% |
| Alaska Natives | 1.8 /100 | #230 | Tragic 14.7% |
| Nigerians | 1.7 /100 | #231 | Tragic 14.8% |
| Osage | 1.5 /100 | #232 | Tragic 14.8% |
| Immigrants | Saudi Arabia | 1.4 /100 | #233 | Tragic 14.8% |
| Fijians | 1.1 /100 | #234 | Tragic 14.9% |
| Immigrants | Laos | 0.9 /100 | #235 | Tragic 15.0% |
| Cree | 0.7 /100 | #236 | Tragic 15.1% |
| French American Indians | 0.6 /100 | #237 | Tragic 15.1% |
| Immigrants | Armenia | 0.6 /100 | #238 | Tragic 15.1% |
| Immigrants | Middle Africa | 0.5 /100 | #239 | Tragic 15.2% |
| Sudanese | 0.5 /100 | #240 | Tragic 15.2% |
| Immigrants | Sudan | 0.4 /100 | #241 | Tragic 15.2% |
| Nepalese | 0.4 /100 | #242 | Tragic 15.2% |
| Nicaraguans | 0.3 /100 | #243 | Tragic 15.3% |
| Ecuadorians | 0.3 /100 | #244 | Tragic 15.3% |
| Spanish American Indians | 0.3 /100 | #245 | Tragic 15.3% |