Immigrants from Caribbean vs Bolivian Married-Couple Family Poverty
COMPARE
Immigrants from Caribbean
Bolivian
Married-Couple Family Poverty
Married-Couple Family Poverty Comparison
Immigrants from Caribbean
Bolivians
7.3%
MARRIED-COUPLE FAMILY POVERTY
0.0/ 100
METRIC RATING
321st/ 347
METRIC RANK
4.6%
MARRIED-COUPLE FAMILY POVERTY
98.6/ 100
METRIC RATING
88th/ 347
METRIC RANK
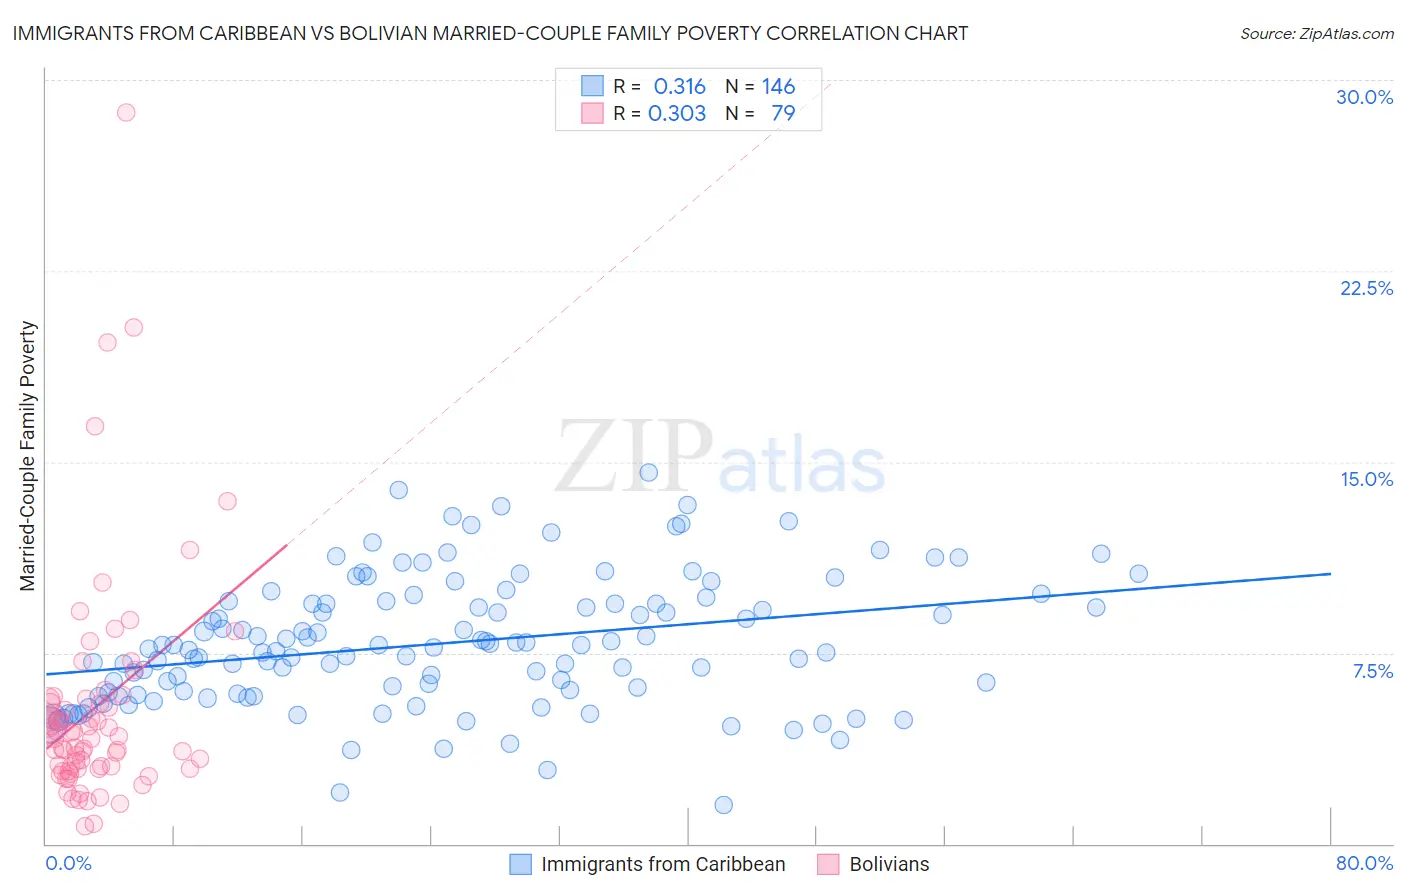
Immigrants from Caribbean vs Bolivian Married-Couple Family Poverty Correlation Chart
The statistical analysis conducted on geographies consisting of 444,708,318 people shows a mild positive correlation between the proportion of Immigrants from Caribbean and poverty level among married-couple families in the United States with a correlation coefficient (R) of 0.316 and weighted average of 7.3%. Similarly, the statistical analysis conducted on geographies consisting of 183,808,216 people shows a mild positive correlation between the proportion of Bolivians and poverty level among married-couple families in the United States with a correlation coefficient (R) of 0.303 and weighted average of 4.6%, a difference of 60.4%.
Married-Couple Family Poverty Correlation Summary
| Measurement | Immigrants from Caribbean | Bolivian |
| Minimum | 1.5% | 0.69% |
| Maximum | 14.6% | 28.7% |
| Range | 13.1% | 28.0% |
| Mean | 7.9% | 5.3% |
| Median | 7.7% | 4.2% |
| Interquartile 25% (IQ1) | 5.9% | 3.0% |
| Interquartile 75% (IQ3) | 9.4% | 5.6% |
| Interquartile Range (IQR) | 3.5% | 2.6% |
| Standard Deviation (Sample) | 2.5% | 4.5% |
| Standard Deviation (Population) | 2.5% | 4.5% |
Similar Demographics by Married-Couple Family Poverty
Demographics Similar to Immigrants from Caribbean by Married-Couple Family Poverty
In terms of married-couple family poverty, the demographic groups most similar to Immigrants from Caribbean are Immigrants from Honduras (7.3%, a difference of 0.030%), Immigrants from Grenada (7.3%, a difference of 0.77%), Vietnamese (7.4%, a difference of 1.1%), Immigrants from Central America (7.4%, a difference of 1.2%), and Immigrants from Cuba (7.5%, a difference of 1.7%).
| Demographics | Rating | Rank | Married-Couple Family Poverty |
| British West Indians | 0.0 /100 | #314 | Tragic 7.1% |
| Inupiat | 0.0 /100 | #315 | Tragic 7.1% |
| Hondurans | 0.0 /100 | #316 | Tragic 7.2% |
| Mexicans | 0.0 /100 | #317 | Tragic 7.2% |
| Immigrants | Guatemala | 0.0 /100 | #318 | Tragic 7.2% |
| Immigrants | Latin America | 0.0 /100 | #319 | Tragic 7.2% |
| Immigrants | Grenada | 0.0 /100 | #320 | Tragic 7.3% |
| Immigrants | Caribbean | 0.0 /100 | #321 | Tragic 7.3% |
| Immigrants | Honduras | 0.0 /100 | #322 | Tragic 7.3% |
| Vietnamese | 0.0 /100 | #323 | Tragic 7.4% |
| Immigrants | Central America | 0.0 /100 | #324 | Tragic 7.4% |
| Immigrants | Cuba | 0.0 /100 | #325 | Tragic 7.5% |
| Immigrants | Bangladesh | 0.0 /100 | #326 | Tragic 7.5% |
| Hispanics or Latinos | 0.0 /100 | #327 | Tragic 7.5% |
| Immigrants | Mexico | 0.0 /100 | #328 | Tragic 7.6% |
Demographics Similar to Bolivians by Married-Couple Family Poverty
In terms of married-couple family poverty, the demographic groups most similar to Bolivians are Immigrants from North Macedonia (4.6%, a difference of 0.10%), Immigrants from Czechoslovakia (4.6%, a difference of 0.11%), Immigrants from Turkey (4.6%, a difference of 0.18%), Immigrants from Switzerland (4.6%, a difference of 0.18%), and South African (4.6%, a difference of 0.22%).
| Demographics | Rating | Rank | Married-Couple Family Poverty |
| Immigrants | Greece | 98.9 /100 | #81 | Exceptional 4.5% |
| Canadians | 98.8 /100 | #82 | Exceptional 4.5% |
| Immigrants | Denmark | 98.8 /100 | #83 | Exceptional 4.6% |
| Immigrants | Croatia | 98.7 /100 | #84 | Exceptional 4.6% |
| South Africans | 98.7 /100 | #85 | Exceptional 4.6% |
| Immigrants | Turkey | 98.6 /100 | #86 | Exceptional 4.6% |
| Immigrants | North Macedonia | 98.6 /100 | #87 | Exceptional 4.6% |
| Bolivians | 98.6 /100 | #88 | Exceptional 4.6% |
| Immigrants | Czechoslovakia | 98.5 /100 | #89 | Exceptional 4.6% |
| Immigrants | Switzerland | 98.5 /100 | #90 | Exceptional 4.6% |
| Basques | 98.5 /100 | #91 | Exceptional 4.6% |
| Immigrants | Norway | 98.4 /100 | #92 | Exceptional 4.6% |
| Koreans | 98.3 /100 | #93 | Exceptional 4.6% |
| Immigrants | Italy | 98.3 /100 | #94 | Exceptional 4.6% |
| Portuguese | 98.3 /100 | #95 | Exceptional 4.6% |