Immigrants from Ecuador vs Immigrants from Venezuela In Labor Force | Age 16-19
COMPARE
Immigrants from Ecuador
Immigrants from Venezuela
In Labor Force | Age 16-19
In Labor Force | Age 16-19 Comparison
Immigrants from Ecuador
Immigrants from Venezuela
31.0%
IN LABOR FORCE | AGE 16-19
0.0/ 100
METRIC RATING
328th/ 347
METRIC RANK
33.7%
IN LABOR FORCE | AGE 16-19
0.2/ 100
METRIC RATING
283rd/ 347
METRIC RANK
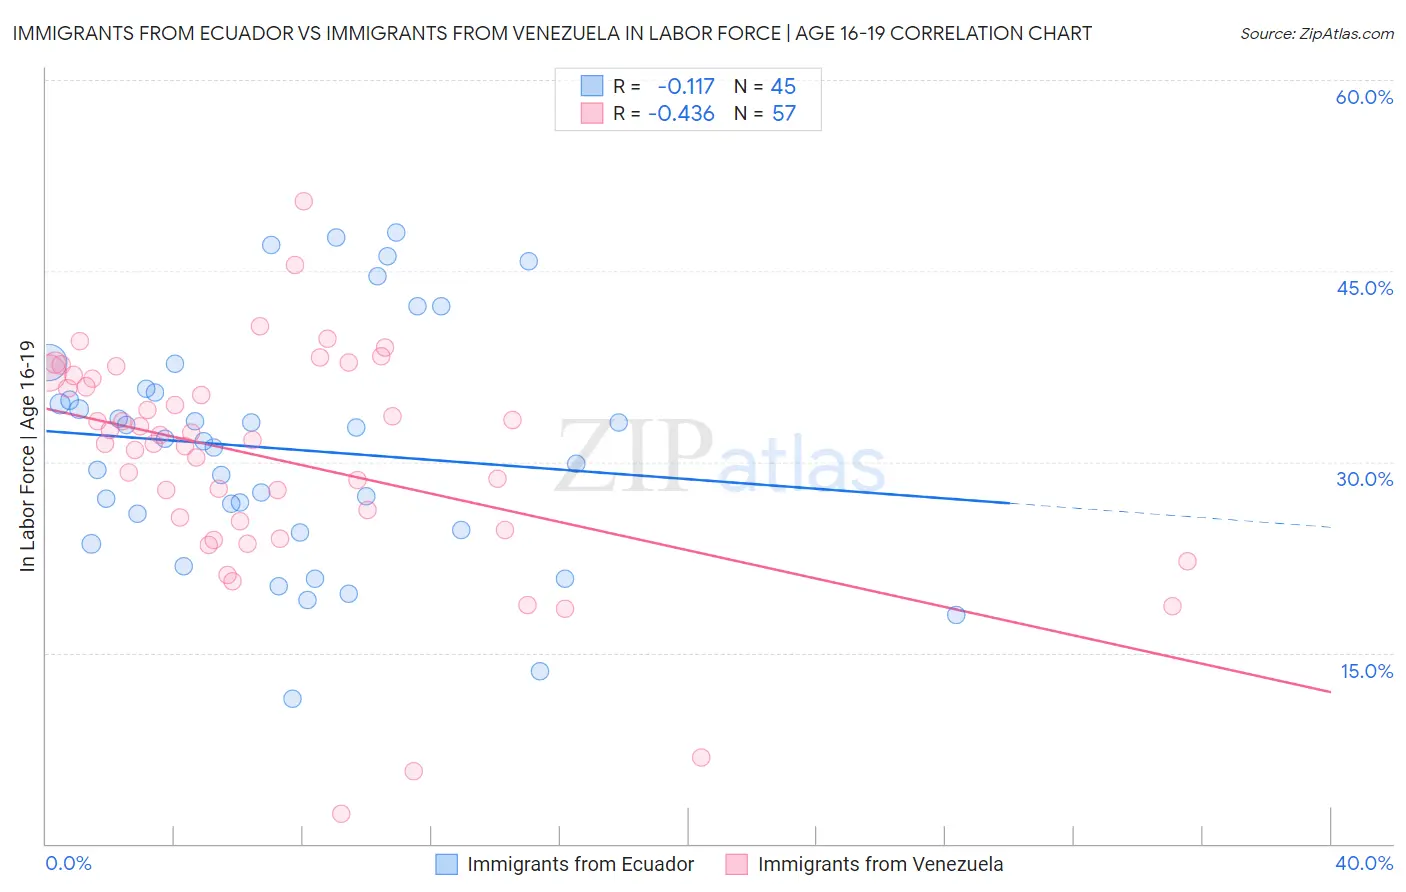
Immigrants from Ecuador vs Immigrants from Venezuela In Labor Force | Age 16-19 Correlation Chart
The statistical analysis conducted on geographies consisting of 270,745,839 people shows a poor negative correlation between the proportion of Immigrants from Ecuador and labor force participation rate among population between the ages 16 and 19 in the United States with a correlation coefficient (R) of -0.117 and weighted average of 31.0%. Similarly, the statistical analysis conducted on geographies consisting of 287,600,436 people shows a moderate negative correlation between the proportion of Immigrants from Venezuela and labor force participation rate among population between the ages 16 and 19 in the United States with a correlation coefficient (R) of -0.436 and weighted average of 33.7%, a difference of 8.7%.
In Labor Force | Age 16-19 Correlation Summary
| Measurement | Immigrants from Ecuador | Immigrants from Venezuela |
| Minimum | 11.4% | 2.4% |
| Maximum | 48.1% | 50.5% |
| Range | 36.7% | 48.1% |
| Mean | 31.0% | 30.2% |
| Median | 31.6% | 31.7% |
| Interquartile 25% (IQ1) | 24.5% | 25.0% |
| Interquartile 75% (IQ3) | 35.6% | 36.7% |
| Interquartile Range (IQR) | 11.1% | 11.7% |
| Standard Deviation (Sample) | 9.2% | 9.0% |
| Standard Deviation (Population) | 9.1% | 8.9% |
Similar Demographics by In Labor Force | Age 16-19
Demographics Similar to Immigrants from Ecuador by In Labor Force | Age 16-19
In terms of in labor force | age 16-19, the demographic groups most similar to Immigrants from Ecuador are Barbadian (31.0%, a difference of 0.030%), Immigrants from Taiwan (31.0%, a difference of 0.040%), Lumbee (31.0%, a difference of 0.15%), Immigrants from Dominican Republic (31.1%, a difference of 0.20%), and Trinidadian and Tobagonian (30.9%, a difference of 0.30%).
| Demographics | Rating | Rank | In Labor Force | Age 16-19 |
| West Indians | 0.0 /100 | #321 | Tragic 31.3% |
| Tohono O'odham | 0.0 /100 | #322 | Tragic 31.3% |
| Immigrants | Caribbean | 0.0 /100 | #323 | Tragic 31.2% |
| Dominicans | 0.0 /100 | #324 | Tragic 31.2% |
| Immigrants | China | 0.0 /100 | #325 | Tragic 31.1% |
| Immigrants | Dominican Republic | 0.0 /100 | #326 | Tragic 31.1% |
| Immigrants | Taiwan | 0.0 /100 | #327 | Tragic 31.0% |
| Immigrants | Ecuador | 0.0 /100 | #328 | Tragic 31.0% |
| Barbadians | 0.0 /100 | #329 | Tragic 31.0% |
| Lumbee | 0.0 /100 | #330 | Tragic 31.0% |
| Trinidadians and Tobagonians | 0.0 /100 | #331 | Tragic 30.9% |
| Immigrants | Israel | 0.0 /100 | #332 | Tragic 30.5% |
| Immigrants | Hong Kong | 0.0 /100 | #333 | Tragic 30.5% |
| Puerto Ricans | 0.0 /100 | #334 | Tragic 30.3% |
| Immigrants | Cuba | 0.0 /100 | #335 | Tragic 30.2% |
Demographics Similar to Immigrants from Venezuela by In Labor Force | Age 16-19
In terms of in labor force | age 16-19, the demographic groups most similar to Immigrants from Venezuela are Immigrants from Spain (33.7%, a difference of 0.060%), U.S. Virgin Islander (33.6%, a difference of 0.25%), South American (33.6%, a difference of 0.34%), Immigrants from Korea (33.8%, a difference of 0.35%), and Cypriot (33.8%, a difference of 0.36%).
| Demographics | Rating | Rank | In Labor Force | Age 16-19 |
| Immigrants | Latin America | 0.3 /100 | #276 | Tragic 33.9% |
| Menominee | 0.3 /100 | #277 | Tragic 33.9% |
| Colombians | 0.3 /100 | #278 | Tragic 33.8% |
| Paraguayans | 0.3 /100 | #279 | Tragic 33.8% |
| Taiwanese | 0.3 /100 | #280 | Tragic 33.8% |
| Cypriots | 0.3 /100 | #281 | Tragic 33.8% |
| Immigrants | Korea | 0.3 /100 | #282 | Tragic 33.8% |
| Immigrants | Venezuela | 0.2 /100 | #283 | Tragic 33.7% |
| Immigrants | Spain | 0.2 /100 | #284 | Tragic 33.7% |
| U.S. Virgin Islanders | 0.2 /100 | #285 | Tragic 33.6% |
| South Americans | 0.2 /100 | #286 | Tragic 33.6% |
| Nepalese | 0.1 /100 | #287 | Tragic 33.5% |
| Immigrants | Indonesia | 0.1 /100 | #288 | Tragic 33.5% |
| Immigrants | Singapore | 0.1 /100 | #289 | Tragic 33.5% |
| Immigrants | Colombia | 0.1 /100 | #290 | Tragic 33.5% |