Immigrants from Denmark vs British West Indian Female Poverty
COMPARE
Immigrants from Denmark
British West Indian
Female Poverty
Female Poverty Comparison
Immigrants from Denmark
British West Indians
12.4%
FEMALE POVERTY
95.8/ 100
METRIC RATING
90th/ 347
METRIC RANK
17.0%
FEMALE POVERTY
0.0/ 100
METRIC RATING
313th/ 347
METRIC RANK
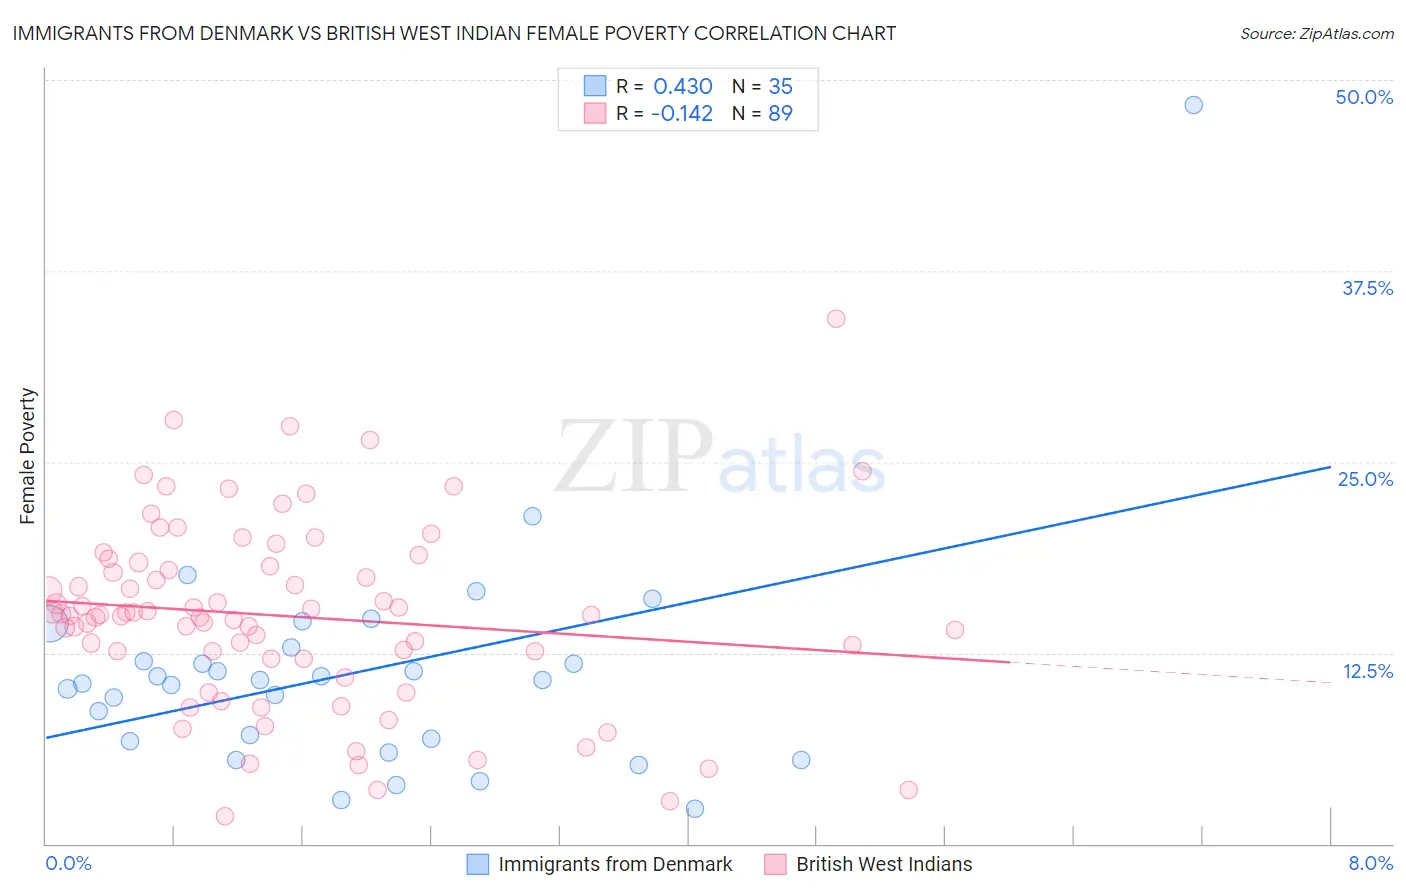
Immigrants from Denmark vs British West Indian Female Poverty Correlation Chart
The statistical analysis conducted on geographies consisting of 136,395,375 people shows a moderate positive correlation between the proportion of Immigrants from Denmark and poverty level among females in the United States with a correlation coefficient (R) of 0.430 and weighted average of 12.4%. Similarly, the statistical analysis conducted on geographies consisting of 152,611,621 people shows a poor negative correlation between the proportion of British West Indians and poverty level among females in the United States with a correlation coefficient (R) of -0.142 and weighted average of 17.0%, a difference of 37.0%.
Female Poverty Correlation Summary
| Measurement | Immigrants from Denmark | British West Indian |
| Minimum | 2.3% | 1.8% |
| Maximum | 48.4% | 34.4% |
| Range | 46.1% | 32.6% |
| Mean | 11.2% | 14.9% |
| Median | 10.7% | 15.0% |
| Interquartile 25% (IQ1) | 6.7% | 12.1% |
| Interquartile 75% (IQ3) | 12.9% | 18.3% |
| Interquartile Range (IQR) | 6.1% | 6.2% |
| Standard Deviation (Sample) | 7.8% | 6.1% |
| Standard Deviation (Population) | 7.7% | 6.0% |
Similar Demographics by Female Poverty
Demographics Similar to Immigrants from Denmark by Female Poverty
In terms of female poverty, the demographic groups most similar to Immigrants from Denmark are Belgian (12.4%, a difference of 0.010%), Czechoslovakian (12.4%, a difference of 0.020%), Immigrants from Egypt (12.5%, a difference of 0.20%), English (12.4%, a difference of 0.22%), and Immigrants from Indonesia (12.5%, a difference of 0.22%).
| Demographics | Rating | Rank | Female Poverty |
| Immigrants | England | 96.9 /100 | #83 | Exceptional 12.3% |
| Northern Europeans | 96.6 /100 | #84 | Exceptional 12.4% |
| Irish | 96.5 /100 | #85 | Exceptional 12.4% |
| Dutch | 96.5 /100 | #86 | Exceptional 12.4% |
| Okinawans | 96.4 /100 | #87 | Exceptional 12.4% |
| Finns | 96.4 /100 | #88 | Exceptional 12.4% |
| English | 96.1 /100 | #89 | Exceptional 12.4% |
| Immigrants | Denmark | 95.8 /100 | #90 | Exceptional 12.4% |
| Belgians | 95.8 /100 | #91 | Exceptional 12.4% |
| Czechoslovakians | 95.7 /100 | #92 | Exceptional 12.4% |
| Immigrants | Egypt | 95.5 /100 | #93 | Exceptional 12.5% |
| Immigrants | Indonesia | 95.4 /100 | #94 | Exceptional 12.5% |
| Immigrants | South Africa | 95.4 /100 | #95 | Exceptional 12.5% |
| British | 95.2 /100 | #96 | Exceptional 12.5% |
| Australians | 95.2 /100 | #97 | Exceptional 12.5% |
Demographics Similar to British West Indians by Female Poverty
In terms of female poverty, the demographic groups most similar to British West Indians are Immigrants from Somalia (17.0%, a difference of 0.080%), Creek (17.0%, a difference of 0.17%), Immigrants from Guatemala (17.0%, a difference of 0.17%), Dutch West Indian (17.1%, a difference of 0.25%), and Immigrants from Mexico (17.0%, a difference of 0.41%).
| Demographics | Rating | Rank | Female Poverty |
| Immigrants | Caribbean | 0.0 /100 | #306 | Tragic 16.9% |
| Seminole | 0.0 /100 | #307 | Tragic 16.9% |
| Africans | 0.0 /100 | #308 | Tragic 16.9% |
| Immigrants | Mexico | 0.0 /100 | #309 | Tragic 17.0% |
| Creek | 0.0 /100 | #310 | Tragic 17.0% |
| Immigrants | Guatemala | 0.0 /100 | #311 | Tragic 17.0% |
| Immigrants | Somalia | 0.0 /100 | #312 | Tragic 17.0% |
| British West Indians | 0.0 /100 | #313 | Tragic 17.0% |
| Dutch West Indians | 0.0 /100 | #314 | Tragic 17.1% |
| U.S. Virgin Islanders | 0.0 /100 | #315 | Tragic 17.3% |
| Hondurans | 0.0 /100 | #316 | Tragic 17.4% |
| Immigrants | Congo | 0.0 /100 | #317 | Tragic 17.4% |
| Ute | 0.0 /100 | #318 | Tragic 17.5% |
| Cajuns | 0.0 /100 | #319 | Tragic 17.5% |
| Immigrants | Dominica | 0.0 /100 | #320 | Tragic 17.5% |