Immigrants from Denmark vs Alaska Native Female Poverty
COMPARE
Immigrants from Denmark
Alaska Native
Female Poverty
Female Poverty Comparison
Immigrants from Denmark
Alaska Natives
12.4%
FEMALE POVERTY
95.8/ 100
METRIC RATING
90th/ 347
METRIC RANK
14.7%
FEMALE POVERTY
1.8/ 100
METRIC RATING
230th/ 347
METRIC RANK
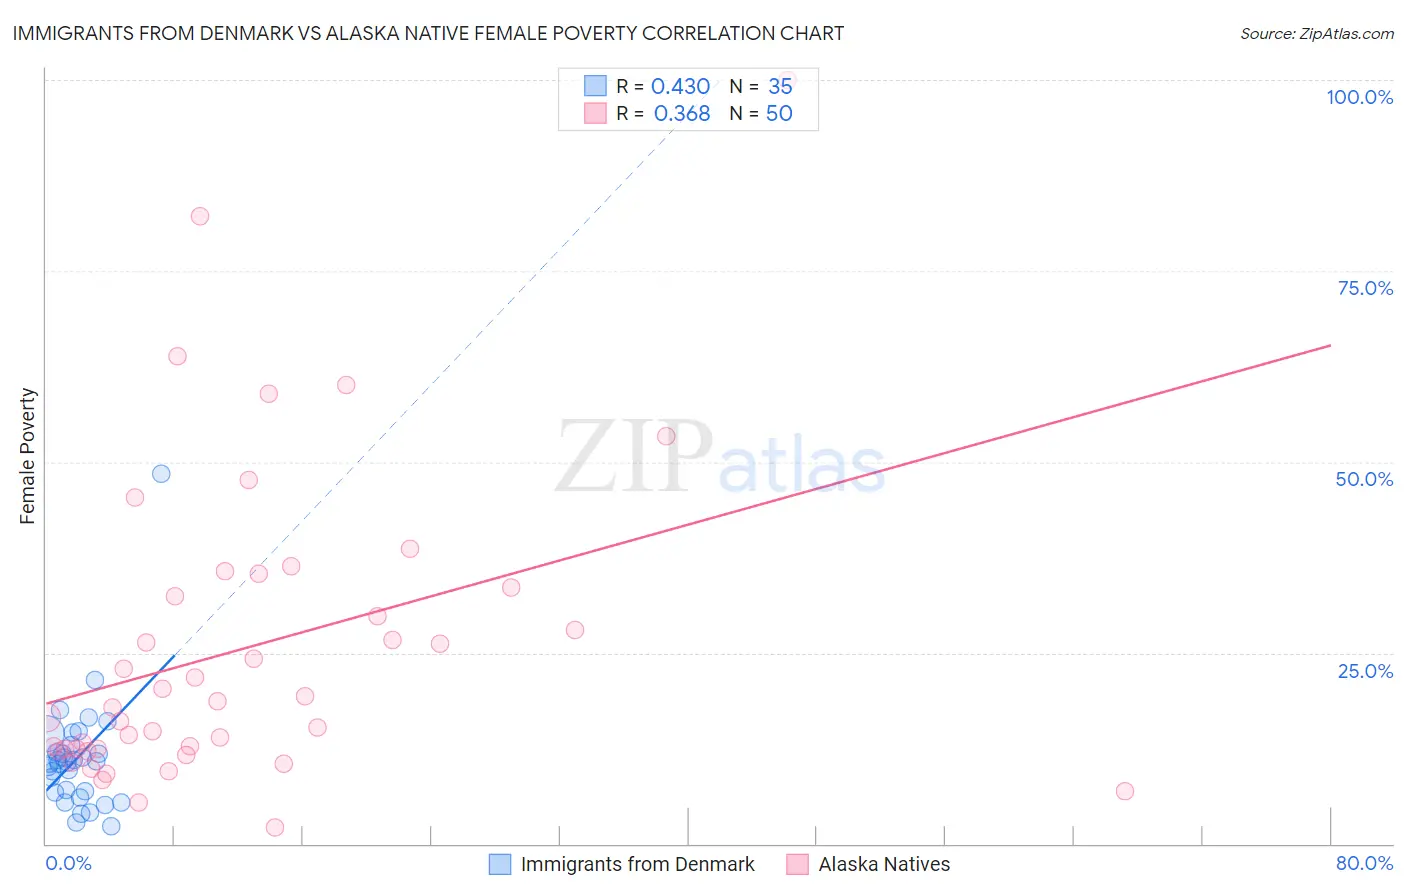
Immigrants from Denmark vs Alaska Native Female Poverty Correlation Chart
The statistical analysis conducted on geographies consisting of 136,395,375 people shows a moderate positive correlation between the proportion of Immigrants from Denmark and poverty level among females in the United States with a correlation coefficient (R) of 0.430 and weighted average of 12.4%. Similarly, the statistical analysis conducted on geographies consisting of 76,751,650 people shows a mild positive correlation between the proportion of Alaska Natives and poverty level among females in the United States with a correlation coefficient (R) of 0.368 and weighted average of 14.7%, a difference of 18.6%.
Female Poverty Correlation Summary
| Measurement | Immigrants from Denmark | Alaska Native |
| Minimum | 2.3% | 2.1% |
| Maximum | 48.4% | 100.0% |
| Range | 46.1% | 97.9% |
| Mean | 11.2% | 25.6% |
| Median | 10.7% | 18.2% |
| Interquartile 25% (IQ1) | 6.7% | 12.4% |
| Interquartile 75% (IQ3) | 12.9% | 33.6% |
| Interquartile Range (IQR) | 6.1% | 21.2% |
| Standard Deviation (Sample) | 7.8% | 20.2% |
| Standard Deviation (Population) | 7.7% | 20.0% |
Similar Demographics by Female Poverty
Demographics Similar to Immigrants from Denmark by Female Poverty
In terms of female poverty, the demographic groups most similar to Immigrants from Denmark are Belgian (12.4%, a difference of 0.010%), Czechoslovakian (12.4%, a difference of 0.020%), Immigrants from Egypt (12.5%, a difference of 0.20%), English (12.4%, a difference of 0.22%), and Immigrants from Indonesia (12.5%, a difference of 0.22%).
| Demographics | Rating | Rank | Female Poverty |
| Immigrants | England | 96.9 /100 | #83 | Exceptional 12.3% |
| Northern Europeans | 96.6 /100 | #84 | Exceptional 12.4% |
| Irish | 96.5 /100 | #85 | Exceptional 12.4% |
| Dutch | 96.5 /100 | #86 | Exceptional 12.4% |
| Okinawans | 96.4 /100 | #87 | Exceptional 12.4% |
| Finns | 96.4 /100 | #88 | Exceptional 12.4% |
| English | 96.1 /100 | #89 | Exceptional 12.4% |
| Immigrants | Denmark | 95.8 /100 | #90 | Exceptional 12.4% |
| Belgians | 95.8 /100 | #91 | Exceptional 12.4% |
| Czechoslovakians | 95.7 /100 | #92 | Exceptional 12.4% |
| Immigrants | Egypt | 95.5 /100 | #93 | Exceptional 12.5% |
| Immigrants | Indonesia | 95.4 /100 | #94 | Exceptional 12.5% |
| Immigrants | South Africa | 95.4 /100 | #95 | Exceptional 12.5% |
| British | 95.2 /100 | #96 | Exceptional 12.5% |
| Australians | 95.2 /100 | #97 | Exceptional 12.5% |
Demographics Similar to Alaska Natives by Female Poverty
In terms of female poverty, the demographic groups most similar to Alaska Natives are Nigerian (14.8%, a difference of 0.10%), Ghanaian (14.7%, a difference of 0.20%), German Russian (14.7%, a difference of 0.27%), Immigrants from Nigeria (14.7%, a difference of 0.41%), and Osage (14.8%, a difference of 0.41%).
| Demographics | Rating | Rank | Female Poverty |
| Immigrants | Africa | 3.3 /100 | #223 | Tragic 14.5% |
| Americans | 2.8 /100 | #224 | Tragic 14.6% |
| Immigrants | Micronesia | 2.8 /100 | #225 | Tragic 14.6% |
| Immigrants | Eritrea | 2.4 /100 | #226 | Tragic 14.6% |
| Immigrants | Nigeria | 2.1 /100 | #227 | Tragic 14.7% |
| German Russians | 2.0 /100 | #228 | Tragic 14.7% |
| Ghanaians | 1.9 /100 | #229 | Tragic 14.7% |
| Alaska Natives | 1.8 /100 | #230 | Tragic 14.7% |
| Nigerians | 1.7 /100 | #231 | Tragic 14.8% |
| Osage | 1.5 /100 | #232 | Tragic 14.8% |
| Immigrants | Saudi Arabia | 1.4 /100 | #233 | Tragic 14.8% |
| Fijians | 1.1 /100 | #234 | Tragic 14.9% |
| Immigrants | Laos | 0.9 /100 | #235 | Tragic 15.0% |
| Cree | 0.7 /100 | #236 | Tragic 15.1% |
| French American Indians | 0.6 /100 | #237 | Tragic 15.1% |