Immigrants from Croatia vs Cape Verdean Poverty
COMPARE
Immigrants from Croatia
Cape Verdean
Poverty
Poverty Comparison
Immigrants from Croatia
Cape Verdeans
11.0%
POVERTY
98.7/ 100
METRIC RATING
51st/ 347
METRIC RANK
14.4%
POVERTY
0.1/ 100
METRIC RATING
260th/ 347
METRIC RANK
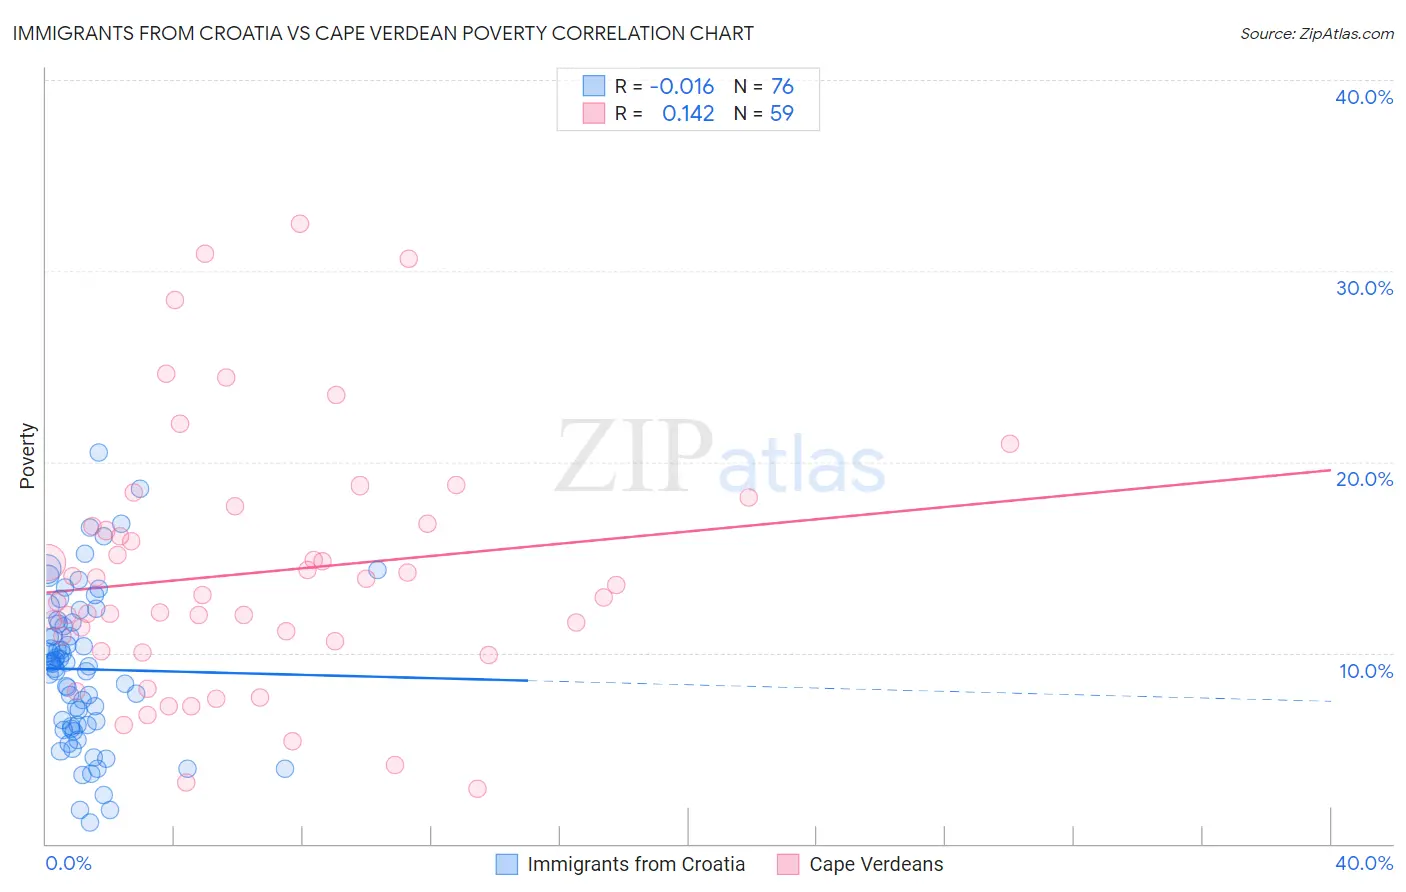
Immigrants from Croatia vs Cape Verdean Poverty Correlation Chart
The statistical analysis conducted on geographies consisting of 132,563,903 people shows no correlation between the proportion of Immigrants from Croatia and poverty level in the United States with a correlation coefficient (R) of -0.016 and weighted average of 11.0%. Similarly, the statistical analysis conducted on geographies consisting of 107,560,730 people shows a poor positive correlation between the proportion of Cape Verdeans and poverty level in the United States with a correlation coefficient (R) of 0.142 and weighted average of 14.4%, a difference of 30.1%.
Poverty Correlation Summary
| Measurement | Immigrants from Croatia | Cape Verdean |
| Minimum | 1.1% | 2.9% |
| Maximum | 20.5% | 32.5% |
| Range | 19.4% | 29.6% |
| Mean | 9.1% | 14.2% |
| Median | 9.4% | 13.0% |
| Interquartile 25% (IQ1) | 6.2% | 10.1% |
| Interquartile 75% (IQ3) | 11.6% | 16.7% |
| Interquartile Range (IQR) | 5.4% | 6.6% |
| Standard Deviation (Sample) | 4.0% | 6.6% |
| Standard Deviation (Population) | 4.0% | 6.6% |
Similar Demographics by Poverty
Demographics Similar to Immigrants from Croatia by Poverty
In terms of poverty, the demographic groups most similar to Immigrants from Croatia are Immigrants from Philippines (11.0%, a difference of 0.020%), Immigrants from Austria (11.1%, a difference of 0.24%), Immigrants from Bulgaria (11.1%, a difference of 0.36%), Immigrants from Serbia (11.1%, a difference of 0.39%), and Asian (11.0%, a difference of 0.41%).
| Demographics | Rating | Rank | Poverty |
| Immigrants | Moldova | 99.1 /100 | #44 | Exceptional 10.9% |
| Turks | 98.9 /100 | #45 | Exceptional 11.0% |
| Immigrants | Czechoslovakia | 98.9 /100 | #46 | Exceptional 11.0% |
| Immigrants | Romania | 98.9 /100 | #47 | Exceptional 11.0% |
| Slovenes | 98.9 /100 | #48 | Exceptional 11.0% |
| Immigrants | Japan | 98.9 /100 | #49 | Exceptional 11.0% |
| Asians | 98.9 /100 | #50 | Exceptional 11.0% |
| Immigrants | Croatia | 98.7 /100 | #51 | Exceptional 11.0% |
| Immigrants | Philippines | 98.7 /100 | #52 | Exceptional 11.0% |
| Immigrants | Austria | 98.6 /100 | #53 | Exceptional 11.1% |
| Immigrants | Bulgaria | 98.5 /100 | #54 | Exceptional 11.1% |
| Immigrants | Serbia | 98.5 /100 | #55 | Exceptional 11.1% |
| Estonians | 98.2 /100 | #56 | Exceptional 11.1% |
| Scandinavians | 98.2 /100 | #57 | Exceptional 11.1% |
| Germans | 98.1 /100 | #58 | Exceptional 11.1% |
Demographics Similar to Cape Verdeans by Poverty
In terms of poverty, the demographic groups most similar to Cape Verdeans are Cherokee (14.4%, a difference of 0.020%), Immigrants from Nicaragua (14.3%, a difference of 0.080%), Immigrants from Liberia (14.4%, a difference of 0.18%), Ottawa (14.3%, a difference of 0.35%), and Trinidadian and Tobagonian (14.3%, a difference of 0.36%).
| Demographics | Rating | Rank | Poverty |
| Immigrants | Trinidad and Tobago | 0.2 /100 | #253 | Tragic 14.2% |
| Immigrants | El Salvador | 0.1 /100 | #254 | Tragic 14.3% |
| Immigrants | Ecuador | 0.1 /100 | #255 | Tragic 14.3% |
| Mexican American Indians | 0.1 /100 | #256 | Tragic 14.3% |
| Trinidadians and Tobagonians | 0.1 /100 | #257 | Tragic 14.3% |
| Ottawa | 0.1 /100 | #258 | Tragic 14.3% |
| Immigrants | Nicaragua | 0.1 /100 | #259 | Tragic 14.3% |
| Cape Verdeans | 0.1 /100 | #260 | Tragic 14.4% |
| Cherokee | 0.1 /100 | #261 | Tragic 14.4% |
| Immigrants | Liberia | 0.1 /100 | #262 | Tragic 14.4% |
| Jamaicans | 0.1 /100 | #263 | Tragic 14.4% |
| Immigrants | Jamaica | 0.1 /100 | #264 | Tragic 14.4% |
| Immigrants | Guyana | 0.1 /100 | #265 | Tragic 14.5% |
| Guyanese | 0.1 /100 | #266 | Tragic 14.5% |
| Iroquois | 0.1 /100 | #267 | Tragic 14.5% |