Immigrants from Croatia vs Cape Verdean College, 1 year or more
COMPARE
Immigrants from Croatia
Cape Verdean
College, 1 year or more
College, 1 year or more Comparison
Immigrants from Croatia
Cape Verdeans
62.3%
COLLEGE, 1 YEAR OR MORE
97.6/ 100
METRIC RATING
94th/ 347
METRIC RANK
50.3%
COLLEGE, 1 YEAR OR MORE
0.0/ 100
METRIC RATING
329th/ 347
METRIC RANK
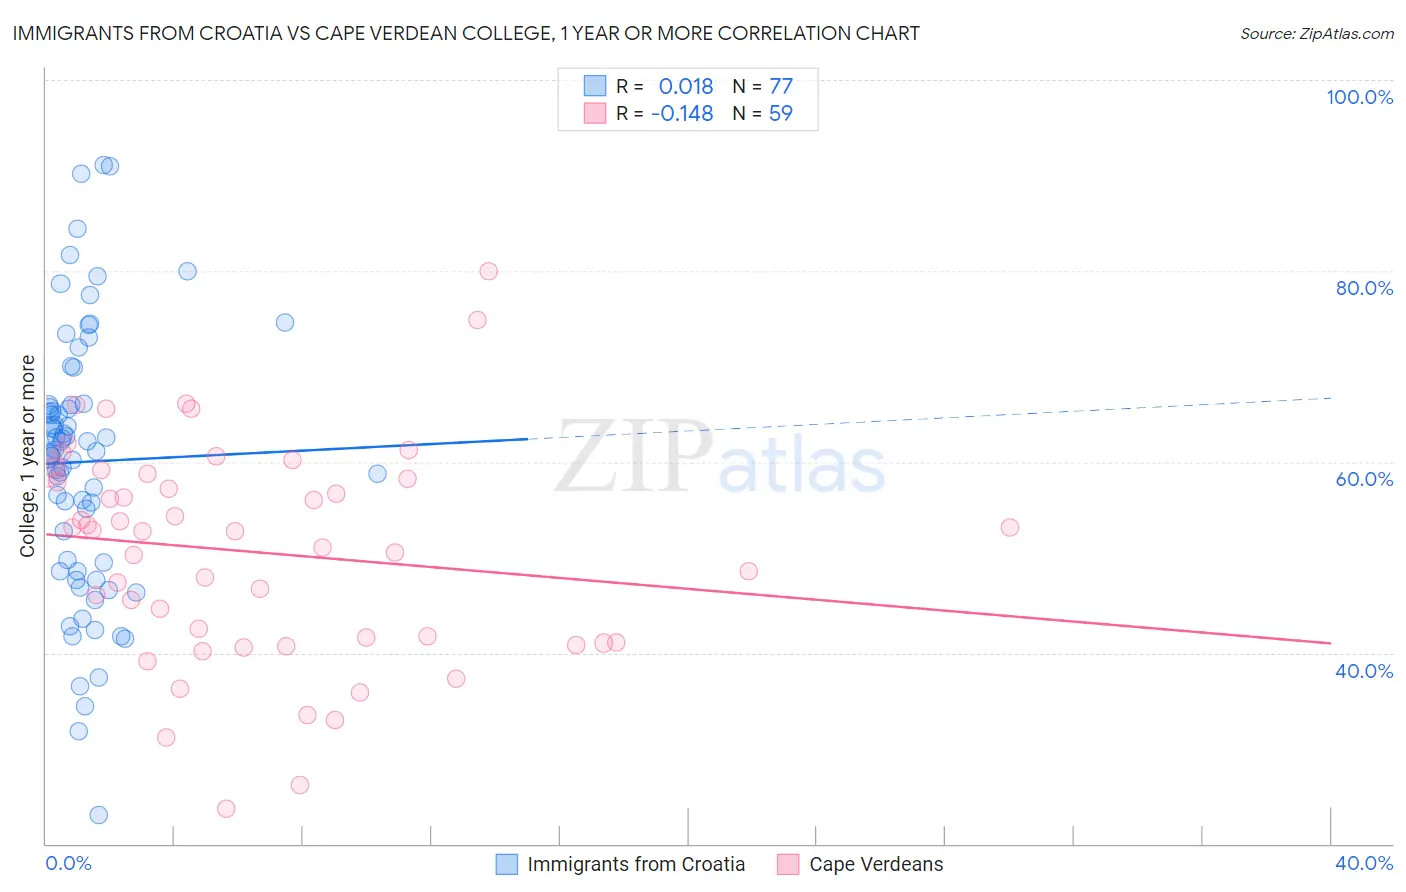
Immigrants from Croatia vs Cape Verdean College, 1 year or more Correlation Chart
The statistical analysis conducted on geographies consisting of 132,577,989 people shows no correlation between the proportion of Immigrants from Croatia and percentage of population with at least college, 1 year or more education in the United States with a correlation coefficient (R) of 0.018 and weighted average of 62.3%. Similarly, the statistical analysis conducted on geographies consisting of 107,580,652 people shows a poor negative correlation between the proportion of Cape Verdeans and percentage of population with at least college, 1 year or more education in the United States with a correlation coefficient (R) of -0.148 and weighted average of 50.3%, a difference of 23.9%.
College, 1 year or more Correlation Summary
| Measurement | Immigrants from Croatia | Cape Verdean |
| Minimum | 23.1% | 23.7% |
| Maximum | 91.1% | 79.9% |
| Range | 68.0% | 56.2% |
| Mean | 60.0% | 50.6% |
| Median | 61.2% | 52.7% |
| Interquartile 25% (IQ1) | 49.0% | 41.1% |
| Interquartile 75% (IQ3) | 66.0% | 58.8% |
| Interquartile Range (IQR) | 17.0% | 17.7% |
| Standard Deviation (Sample) | 13.8% | 11.4% |
| Standard Deviation (Population) | 13.7% | 11.3% |
Similar Demographics by College, 1 year or more
Demographics Similar to Immigrants from Croatia by College, 1 year or more
In terms of college, 1 year or more, the demographic groups most similar to Immigrants from Croatia are Romanian (62.4%, a difference of 0.060%), Immigrants from Eastern Europe (62.4%, a difference of 0.090%), Immigrants from Egypt (62.4%, a difference of 0.090%), British (62.3%, a difference of 0.10%), and Immigrants from Western Asia (62.5%, a difference of 0.20%).
| Demographics | Rating | Rank | College, 1 year or more |
| Immigrants | Hungary | 98.6 /100 | #87 | Exceptional 62.7% |
| Greeks | 98.3 /100 | #88 | Exceptional 62.6% |
| Immigrants | Ethiopia | 98.2 /100 | #89 | Exceptional 62.6% |
| Immigrants | Western Asia | 97.9 /100 | #90 | Exceptional 62.5% |
| Immigrants | Eastern Europe | 97.8 /100 | #91 | Exceptional 62.4% |
| Immigrants | Egypt | 97.8 /100 | #92 | Exceptional 62.4% |
| Romanians | 97.7 /100 | #93 | Exceptional 62.4% |
| Immigrants | Croatia | 97.6 /100 | #94 | Exceptional 62.3% |
| British | 97.4 /100 | #95 | Exceptional 62.3% |
| Chinese | 97.2 /100 | #96 | Exceptional 62.2% |
| Jordanians | 97.2 /100 | #97 | Exceptional 62.2% |
| Carpatho Rusyns | 97.2 /100 | #98 | Exceptional 62.2% |
| Croatians | 97.1 /100 | #99 | Exceptional 62.2% |
| Icelanders | 96.8 /100 | #100 | Exceptional 62.1% |
| Swedes | 96.8 /100 | #101 | Exceptional 62.1% |
Demographics Similar to Cape Verdeans by College, 1 year or more
In terms of college, 1 year or more, the demographic groups most similar to Cape Verdeans are Native/Alaskan (50.2%, a difference of 0.22%), Dutch West Indian (50.5%, a difference of 0.39%), Menominee (50.6%, a difference of 0.51%), Dominican (50.6%, a difference of 0.55%), and Immigrants from Yemen (50.0%, a difference of 0.57%).
| Demographics | Rating | Rank | College, 1 year or more |
| Navajo | 0.0 /100 | #322 | Tragic 50.8% |
| Immigrants | Guatemala | 0.0 /100 | #323 | Tragic 50.7% |
| Immigrants | Cuba | 0.0 /100 | #324 | Tragic 50.7% |
| Immigrants | Latin America | 0.0 /100 | #325 | Tragic 50.7% |
| Dominicans | 0.0 /100 | #326 | Tragic 50.6% |
| Menominee | 0.0 /100 | #327 | Tragic 50.6% |
| Dutch West Indians | 0.0 /100 | #328 | Tragic 50.5% |
| Cape Verdeans | 0.0 /100 | #329 | Tragic 50.3% |
| Natives/Alaskans | 0.0 /100 | #330 | Tragic 50.2% |
| Immigrants | Yemen | 0.0 /100 | #331 | Tragic 50.0% |
| Mexicans | 0.0 /100 | #332 | Tragic 49.2% |
| Immigrants | Dominican Republic | 0.0 /100 | #333 | Tragic 49.1% |
| Lumbee | 0.0 /100 | #334 | Tragic 48.9% |
| Yuman | 0.0 /100 | #335 | Tragic 48.7% |
| Spanish American Indians | 0.0 /100 | #336 | Tragic 48.5% |