Immigrants from Croatia vs Tongan Poverty
COMPARE
Immigrants from Croatia
Tongan
Poverty
Poverty Comparison
Immigrants from Croatia
Tongans
11.0%
POVERTY
98.7/ 100
METRIC RATING
51st/ 347
METRIC RANK
10.8%
POVERTY
99.4/ 100
METRIC RATING
35th/ 347
METRIC RANK
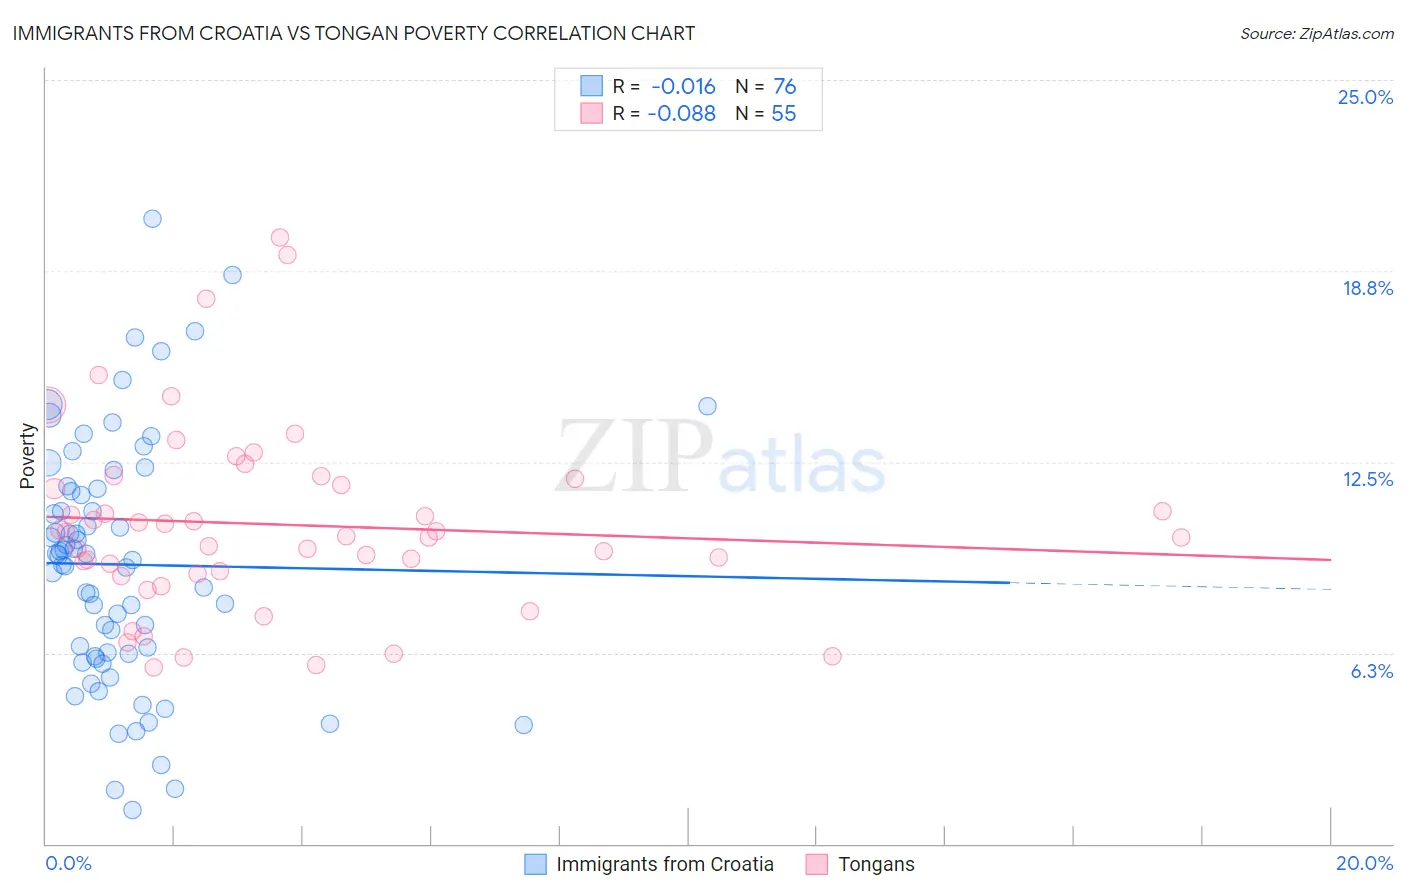
Immigrants from Croatia vs Tongan Poverty Correlation Chart
The statistical analysis conducted on geographies consisting of 132,563,903 people shows no correlation between the proportion of Immigrants from Croatia and poverty level in the United States with a correlation coefficient (R) of -0.016 and weighted average of 11.0%. Similarly, the statistical analysis conducted on geographies consisting of 102,864,002 people shows a slight negative correlation between the proportion of Tongans and poverty level in the United States with a correlation coefficient (R) of -0.088 and weighted average of 10.8%, a difference of 2.0%.
Poverty Correlation Summary
| Measurement | Immigrants from Croatia | Tongan |
| Minimum | 1.1% | 5.8% |
| Maximum | 20.5% | 19.8% |
| Range | 19.4% | 14.1% |
| Mean | 9.1% | 10.4% |
| Median | 9.4% | 10.1% |
| Interquartile 25% (IQ1) | 6.2% | 8.8% |
| Interquartile 75% (IQ3) | 11.6% | 12.0% |
| Interquartile Range (IQR) | 5.4% | 3.1% |
| Standard Deviation (Sample) | 4.0% | 3.1% |
| Standard Deviation (Population) | 4.0% | 3.0% |
Demographics Similar to Immigrants from Croatia and Tongans by Poverty
In terms of poverty, the demographic groups most similar to Immigrants from Croatia are Immigrants from Philippines (11.0%, a difference of 0.020%), Immigrants from Austria (11.1%, a difference of 0.24%), Asian (11.0%, a difference of 0.41%), Immigrants from Japan (11.0%, a difference of 0.44%), and Slovene (11.0%, a difference of 0.45%). Similarly, the demographic groups most similar to Tongans are Immigrants from Poland (10.8%, a difference of 0.040%), Cypriot (10.8%, a difference of 0.080%), Macedonian (10.8%, a difference of 0.14%), Immigrants from Greece (10.8%, a difference of 0.17%), and Czech (10.8%, a difference of 0.22%).
| Demographics | Rating | Rank | Poverty |
| Macedonians | 99.4 /100 | #33 | Exceptional 10.8% |
| Immigrants | Poland | 99.4 /100 | #34 | Exceptional 10.8% |
| Tongans | 99.4 /100 | #35 | Exceptional 10.8% |
| Cypriots | 99.3 /100 | #36 | Exceptional 10.8% |
| Immigrants | Greece | 99.3 /100 | #37 | Exceptional 10.8% |
| Czechs | 99.3 /100 | #38 | Exceptional 10.8% |
| Immigrants | Pakistan | 99.3 /100 | #39 | Exceptional 10.8% |
| Russians | 99.3 /100 | #40 | Exceptional 10.9% |
| Immigrants | Iran | 99.2 /100 | #41 | Exceptional 10.9% |
| Koreans | 99.2 /100 | #42 | Exceptional 10.9% |
| Immigrants | Singapore | 99.2 /100 | #43 | Exceptional 10.9% |
| Immigrants | Moldova | 99.1 /100 | #44 | Exceptional 10.9% |
| Turks | 98.9 /100 | #45 | Exceptional 11.0% |
| Immigrants | Czechoslovakia | 98.9 /100 | #46 | Exceptional 11.0% |
| Immigrants | Romania | 98.9 /100 | #47 | Exceptional 11.0% |
| Slovenes | 98.9 /100 | #48 | Exceptional 11.0% |
| Immigrants | Japan | 98.9 /100 | #49 | Exceptional 11.0% |
| Asians | 98.9 /100 | #50 | Exceptional 11.0% |
| Immigrants | Croatia | 98.7 /100 | #51 | Exceptional 11.0% |
| Immigrants | Philippines | 98.7 /100 | #52 | Exceptional 11.0% |
| Immigrants | Austria | 98.6 /100 | #53 | Exceptional 11.1% |