Immigrants from Croatia vs Guamanian/Chamorro Poverty
COMPARE
Immigrants from Croatia
Guamanian/Chamorro
Poverty
Poverty Comparison
Immigrants from Croatia
Guamanians/Chamorros
11.0%
POVERTY
98.7/ 100
METRIC RATING
51st/ 347
METRIC RANK
12.1%
POVERTY
63.9/ 100
METRIC RATING
154th/ 347
METRIC RANK
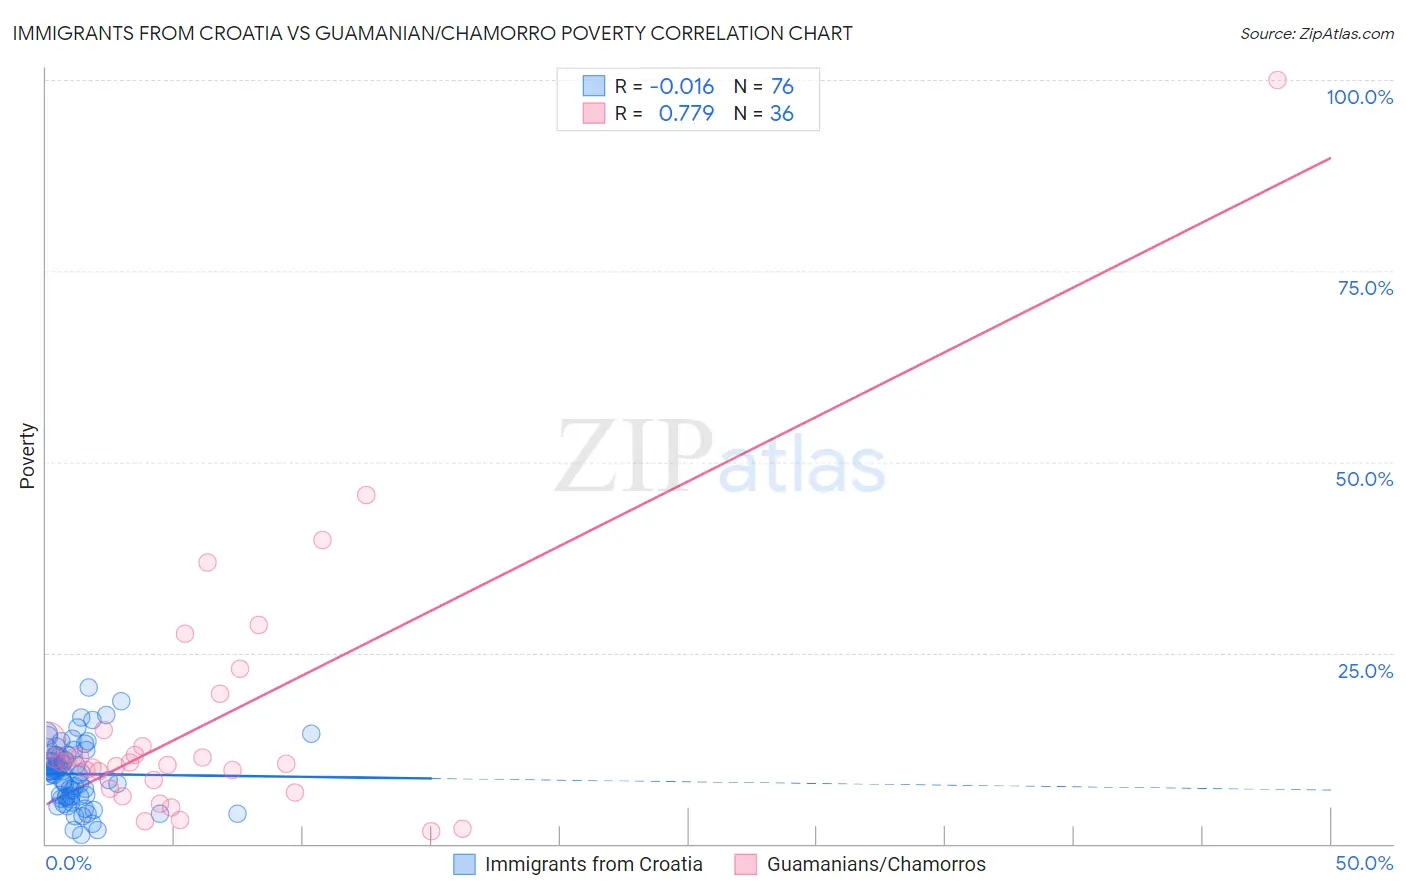
Immigrants from Croatia vs Guamanian/Chamorro Poverty Correlation Chart
The statistical analysis conducted on geographies consisting of 132,563,903 people shows no correlation between the proportion of Immigrants from Croatia and poverty level in the United States with a correlation coefficient (R) of -0.016 and weighted average of 11.0%. Similarly, the statistical analysis conducted on geographies consisting of 221,867,885 people shows a strong positive correlation between the proportion of Guamanians/Chamorros and poverty level in the United States with a correlation coefficient (R) of 0.779 and weighted average of 12.1%, a difference of 10.2%.
Poverty Correlation Summary
| Measurement | Immigrants from Croatia | Guamanian/Chamorro |
| Minimum | 1.1% | 1.7% |
| Maximum | 20.5% | 100.0% |
| Range | 19.4% | 98.3% |
| Mean | 9.1% | 15.8% |
| Median | 9.4% | 10.7% |
| Interquartile 25% (IQ1) | 6.2% | 7.8% |
| Interquartile 75% (IQ3) | 11.6% | 14.3% |
| Interquartile Range (IQR) | 5.4% | 6.5% |
| Standard Deviation (Sample) | 4.0% | 17.8% |
| Standard Deviation (Population) | 4.0% | 17.5% |
Similar Demographics by Poverty
Demographics Similar to Immigrants from Croatia by Poverty
In terms of poverty, the demographic groups most similar to Immigrants from Croatia are Immigrants from Philippines (11.0%, a difference of 0.020%), Immigrants from Austria (11.1%, a difference of 0.24%), Immigrants from Bulgaria (11.1%, a difference of 0.36%), Immigrants from Serbia (11.1%, a difference of 0.39%), and Asian (11.0%, a difference of 0.41%).
| Demographics | Rating | Rank | Poverty |
| Immigrants | Moldova | 99.1 /100 | #44 | Exceptional 10.9% |
| Turks | 98.9 /100 | #45 | Exceptional 11.0% |
| Immigrants | Czechoslovakia | 98.9 /100 | #46 | Exceptional 11.0% |
| Immigrants | Romania | 98.9 /100 | #47 | Exceptional 11.0% |
| Slovenes | 98.9 /100 | #48 | Exceptional 11.0% |
| Immigrants | Japan | 98.9 /100 | #49 | Exceptional 11.0% |
| Asians | 98.9 /100 | #50 | Exceptional 11.0% |
| Immigrants | Croatia | 98.7 /100 | #51 | Exceptional 11.0% |
| Immigrants | Philippines | 98.7 /100 | #52 | Exceptional 11.0% |
| Immigrants | Austria | 98.6 /100 | #53 | Exceptional 11.1% |
| Immigrants | Bulgaria | 98.5 /100 | #54 | Exceptional 11.1% |
| Immigrants | Serbia | 98.5 /100 | #55 | Exceptional 11.1% |
| Estonians | 98.2 /100 | #56 | Exceptional 11.1% |
| Scandinavians | 98.2 /100 | #57 | Exceptional 11.1% |
| Germans | 98.1 /100 | #58 | Exceptional 11.1% |
Demographics Similar to Guamanians/Chamorros by Poverty
In terms of poverty, the demographic groups most similar to Guamanians/Chamorros are Immigrants from Northern Africa (12.1%, a difference of 0.010%), Hungarian (12.2%, a difference of 0.020%), Scotch-Irish (12.2%, a difference of 0.14%), Costa Rican (12.2%, a difference of 0.18%), and Taiwanese (12.2%, a difference of 0.22%).
| Demographics | Rating | Rank | Poverty |
| Immigrants | Bosnia and Herzegovina | 73.7 /100 | #147 | Good 12.0% |
| Immigrants | Germany | 72.7 /100 | #148 | Good 12.0% |
| Immigrants | Malaysia | 72.7 /100 | #149 | Good 12.0% |
| Immigrants | Kazakhstan | 72.3 /100 | #150 | Good 12.0% |
| Samoans | 71.9 /100 | #151 | Good 12.0% |
| Armenians | 67.6 /100 | #152 | Good 12.1% |
| Immigrants | Northern Africa | 63.9 /100 | #153 | Good 12.1% |
| Guamanians/Chamorros | 63.9 /100 | #154 | Good 12.1% |
| Hungarians | 63.6 /100 | #155 | Good 12.2% |
| Scotch-Irish | 62.6 /100 | #156 | Good 12.2% |
| Costa Ricans | 62.2 /100 | #157 | Good 12.2% |
| Taiwanese | 61.8 /100 | #158 | Good 12.2% |
| Pennsylvania Germans | 60.8 /100 | #159 | Good 12.2% |
| Immigrants | Nepal | 60.4 /100 | #160 | Good 12.2% |
| Immigrants | Fiji | 59.1 /100 | #161 | Average 12.2% |