Immigrants from Croatia vs Fijian Poverty
COMPARE
Immigrants from Croatia
Fijian
Poverty
Poverty Comparison
Immigrants from Croatia
Fijians
11.0%
POVERTY
98.7/ 100
METRIC RATING
51st/ 347
METRIC RANK
13.7%
POVERTY
0.8/ 100
METRIC RATING
232nd/ 347
METRIC RANK
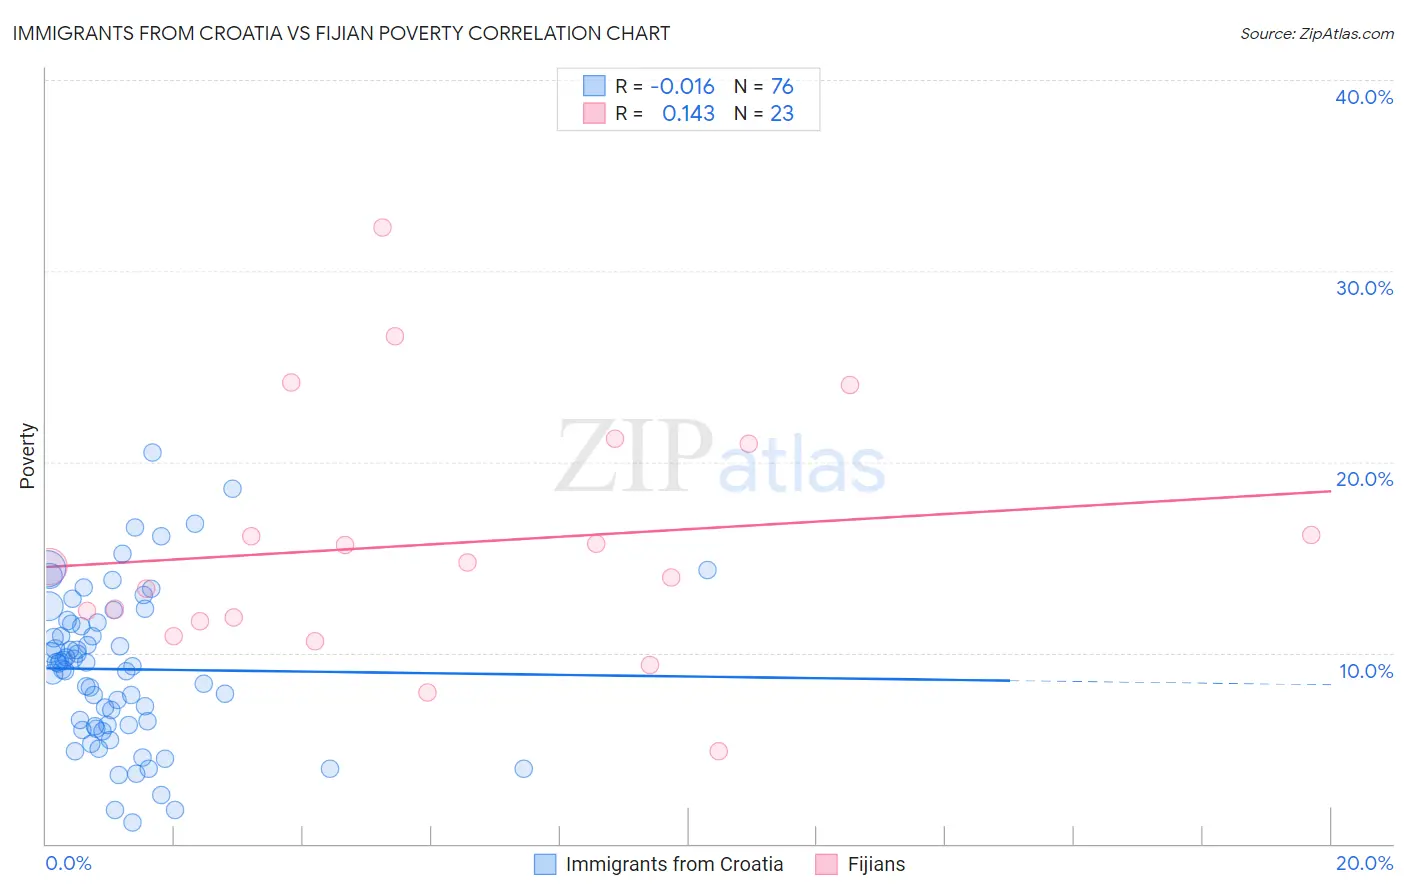
Immigrants from Croatia vs Fijian Poverty Correlation Chart
The statistical analysis conducted on geographies consisting of 132,563,903 people shows no correlation between the proportion of Immigrants from Croatia and poverty level in the United States with a correlation coefficient (R) of -0.016 and weighted average of 11.0%. Similarly, the statistical analysis conducted on geographies consisting of 55,947,896 people shows a poor positive correlation between the proportion of Fijians and poverty level in the United States with a correlation coefficient (R) of 0.143 and weighted average of 13.7%, a difference of 24.6%.
Poverty Correlation Summary
| Measurement | Immigrants from Croatia | Fijian |
| Minimum | 1.1% | 4.9% |
| Maximum | 20.5% | 32.3% |
| Range | 19.4% | 27.5% |
| Mean | 9.1% | 15.7% |
| Median | 9.4% | 14.5% |
| Interquartile 25% (IQ1) | 6.2% | 11.7% |
| Interquartile 75% (IQ3) | 11.6% | 21.0% |
| Interquartile Range (IQR) | 5.4% | 9.3% |
| Standard Deviation (Sample) | 4.0% | 6.5% |
| Standard Deviation (Population) | 4.0% | 6.3% |
Similar Demographics by Poverty
Demographics Similar to Immigrants from Croatia by Poverty
In terms of poverty, the demographic groups most similar to Immigrants from Croatia are Immigrants from Philippines (11.0%, a difference of 0.020%), Immigrants from Austria (11.1%, a difference of 0.24%), Immigrants from Bulgaria (11.1%, a difference of 0.36%), Immigrants from Serbia (11.1%, a difference of 0.39%), and Asian (11.0%, a difference of 0.41%).
| Demographics | Rating | Rank | Poverty |
| Immigrants | Moldova | 99.1 /100 | #44 | Exceptional 10.9% |
| Turks | 98.9 /100 | #45 | Exceptional 11.0% |
| Immigrants | Czechoslovakia | 98.9 /100 | #46 | Exceptional 11.0% |
| Immigrants | Romania | 98.9 /100 | #47 | Exceptional 11.0% |
| Slovenes | 98.9 /100 | #48 | Exceptional 11.0% |
| Immigrants | Japan | 98.9 /100 | #49 | Exceptional 11.0% |
| Asians | 98.9 /100 | #50 | Exceptional 11.0% |
| Immigrants | Croatia | 98.7 /100 | #51 | Exceptional 11.0% |
| Immigrants | Philippines | 98.7 /100 | #52 | Exceptional 11.0% |
| Immigrants | Austria | 98.6 /100 | #53 | Exceptional 11.1% |
| Immigrants | Bulgaria | 98.5 /100 | #54 | Exceptional 11.1% |
| Immigrants | Serbia | 98.5 /100 | #55 | Exceptional 11.1% |
| Estonians | 98.2 /100 | #56 | Exceptional 11.1% |
| Scandinavians | 98.2 /100 | #57 | Exceptional 11.1% |
| Germans | 98.1 /100 | #58 | Exceptional 11.1% |
Demographics Similar to Fijians by Poverty
In terms of poverty, the demographic groups most similar to Fijians are Immigrants from Saudi Arabia (13.8%, a difference of 0.25%), Immigrants from Laos (13.8%, a difference of 0.49%), Cuban (13.9%, a difference of 0.93%), Immigrants from Armenia (13.9%, a difference of 0.96%), and French American Indian (13.9%, a difference of 0.98%).
| Demographics | Rating | Rank | Poverty |
| German Russians | 2.2 /100 | #225 | Tragic 13.4% |
| Marshallese | 2.2 /100 | #226 | Tragic 13.4% |
| Alaska Natives | 2.1 /100 | #227 | Tragic 13.5% |
| Immigrants | Nigeria | 1.7 /100 | #228 | Tragic 13.5% |
| Osage | 1.5 /100 | #229 | Tragic 13.6% |
| Alaskan Athabascans | 1.5 /100 | #230 | Tragic 13.6% |
| Nigerians | 1.4 /100 | #231 | Tragic 13.6% |
| Fijians | 0.8 /100 | #232 | Tragic 13.7% |
| Immigrants | Saudi Arabia | 0.8 /100 | #233 | Tragic 13.8% |
| Immigrants | Laos | 0.7 /100 | #234 | Tragic 13.8% |
| Cubans | 0.6 /100 | #235 | Tragic 13.9% |
| Immigrants | Armenia | 0.5 /100 | #236 | Tragic 13.9% |
| French American Indians | 0.5 /100 | #237 | Tragic 13.9% |
| Ghanaians | 0.5 /100 | #238 | Tragic 13.9% |
| Nicaraguans | 0.4 /100 | #239 | Tragic 13.9% |