Immigrants from Croatia vs Native Hawaiian Poverty
COMPARE
Immigrants from Croatia
Native Hawaiian
Poverty
Poverty Comparison
Immigrants from Croatia
Native Hawaiians
11.0%
POVERTY
98.7/ 100
METRIC RATING
51st/ 347
METRIC RANK
11.6%
POVERTY
92.1/ 100
METRIC RATING
104th/ 347
METRIC RANK
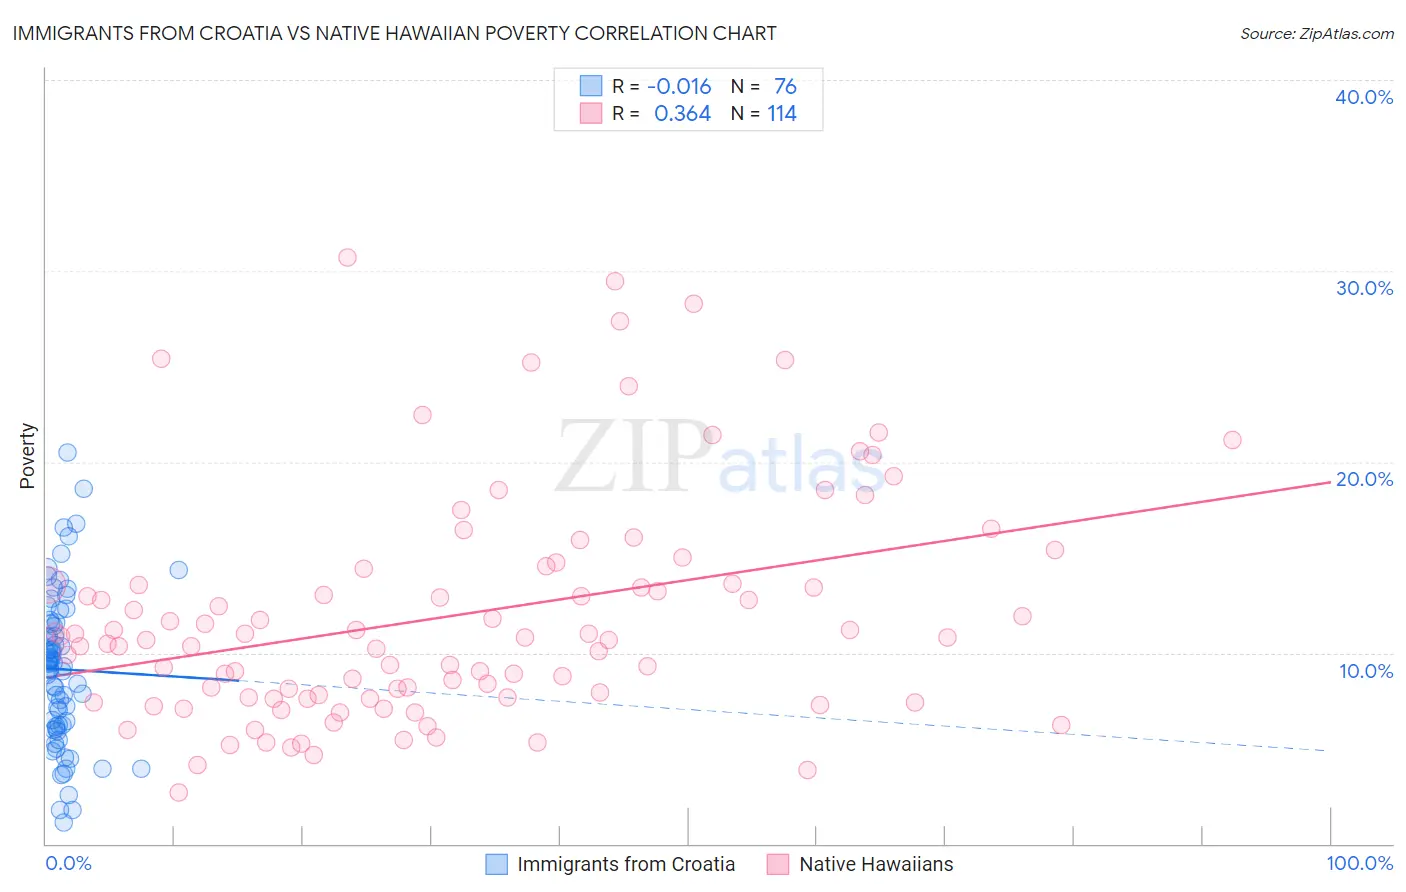
Immigrants from Croatia vs Native Hawaiian Poverty Correlation Chart
The statistical analysis conducted on geographies consisting of 132,563,903 people shows no correlation between the proportion of Immigrants from Croatia and poverty level in the United States with a correlation coefficient (R) of -0.016 and weighted average of 11.0%. Similarly, the statistical analysis conducted on geographies consisting of 331,880,799 people shows a mild positive correlation between the proportion of Native Hawaiians and poverty level in the United States with a correlation coefficient (R) of 0.364 and weighted average of 11.6%, a difference of 5.0%.
Poverty Correlation Summary
| Measurement | Immigrants from Croatia | Native Hawaiian |
| Minimum | 1.1% | 2.7% |
| Maximum | 20.5% | 30.7% |
| Range | 19.4% | 28.0% |
| Mean | 9.1% | 11.9% |
| Median | 9.4% | 10.7% |
| Interquartile 25% (IQ1) | 6.2% | 7.6% |
| Interquartile 75% (IQ3) | 11.6% | 13.6% |
| Interquartile Range (IQR) | 5.4% | 6.0% |
| Standard Deviation (Sample) | 4.0% | 5.9% |
| Standard Deviation (Population) | 4.0% | 5.9% |
Similar Demographics by Poverty
Demographics Similar to Immigrants from Croatia by Poverty
In terms of poverty, the demographic groups most similar to Immigrants from Croatia are Immigrants from Philippines (11.0%, a difference of 0.020%), Immigrants from Austria (11.1%, a difference of 0.24%), Immigrants from Bulgaria (11.1%, a difference of 0.36%), Immigrants from Serbia (11.1%, a difference of 0.39%), and Asian (11.0%, a difference of 0.41%).
| Demographics | Rating | Rank | Poverty |
| Immigrants | Moldova | 99.1 /100 | #44 | Exceptional 10.9% |
| Turks | 98.9 /100 | #45 | Exceptional 11.0% |
| Immigrants | Czechoslovakia | 98.9 /100 | #46 | Exceptional 11.0% |
| Immigrants | Romania | 98.9 /100 | #47 | Exceptional 11.0% |
| Slovenes | 98.9 /100 | #48 | Exceptional 11.0% |
| Immigrants | Japan | 98.9 /100 | #49 | Exceptional 11.0% |
| Asians | 98.9 /100 | #50 | Exceptional 11.0% |
| Immigrants | Croatia | 98.7 /100 | #51 | Exceptional 11.0% |
| Immigrants | Philippines | 98.7 /100 | #52 | Exceptional 11.0% |
| Immigrants | Austria | 98.6 /100 | #53 | Exceptional 11.1% |
| Immigrants | Bulgaria | 98.5 /100 | #54 | Exceptional 11.1% |
| Immigrants | Serbia | 98.5 /100 | #55 | Exceptional 11.1% |
| Estonians | 98.2 /100 | #56 | Exceptional 11.1% |
| Scandinavians | 98.2 /100 | #57 | Exceptional 11.1% |
| Germans | 98.1 /100 | #58 | Exceptional 11.1% |
Demographics Similar to Native Hawaiians by Poverty
In terms of poverty, the demographic groups most similar to Native Hawaiians are Portuguese (11.6%, a difference of 0.020%), Immigrants from Zimbabwe (11.6%, a difference of 0.020%), Laotian (11.6%, a difference of 0.11%), Okinawan (11.6%, a difference of 0.11%), and Palestinian (11.6%, a difference of 0.11%).
| Demographics | Rating | Rank | Poverty |
| Immigrants | Egypt | 94.6 /100 | #97 | Exceptional 11.5% |
| Immigrants | Latvia | 94.5 /100 | #98 | Exceptional 11.5% |
| Immigrants | Indonesia | 94.2 /100 | #99 | Exceptional 11.5% |
| Scottish | 94.0 /100 | #100 | Exceptional 11.5% |
| Slavs | 93.3 /100 | #101 | Exceptional 11.5% |
| Laotians | 92.4 /100 | #102 | Exceptional 11.6% |
| Okinawans | 92.4 /100 | #103 | Exceptional 11.6% |
| Native Hawaiians | 92.1 /100 | #104 | Exceptional 11.6% |
| Portuguese | 92.1 /100 | #105 | Exceptional 11.6% |
| Immigrants | Zimbabwe | 92.1 /100 | #106 | Exceptional 11.6% |
| Palestinians | 91.8 /100 | #107 | Exceptional 11.6% |
| Canadians | 91.7 /100 | #108 | Exceptional 11.6% |
| Immigrants | Turkey | 91.7 /100 | #109 | Exceptional 11.6% |
| Welsh | 91.6 /100 | #110 | Exceptional 11.6% |
| French Canadians | 91.0 /100 | #111 | Exceptional 11.6% |