Liberian vs Cape Verdean Poverty
COMPARE
Liberian
Cape Verdean
Poverty
Poverty Comparison
Liberians
Cape Verdeans
14.1%
POVERTY
0.2/ 100
METRIC RATING
247th/ 347
METRIC RANK
14.4%
POVERTY
0.1/ 100
METRIC RATING
260th/ 347
METRIC RANK
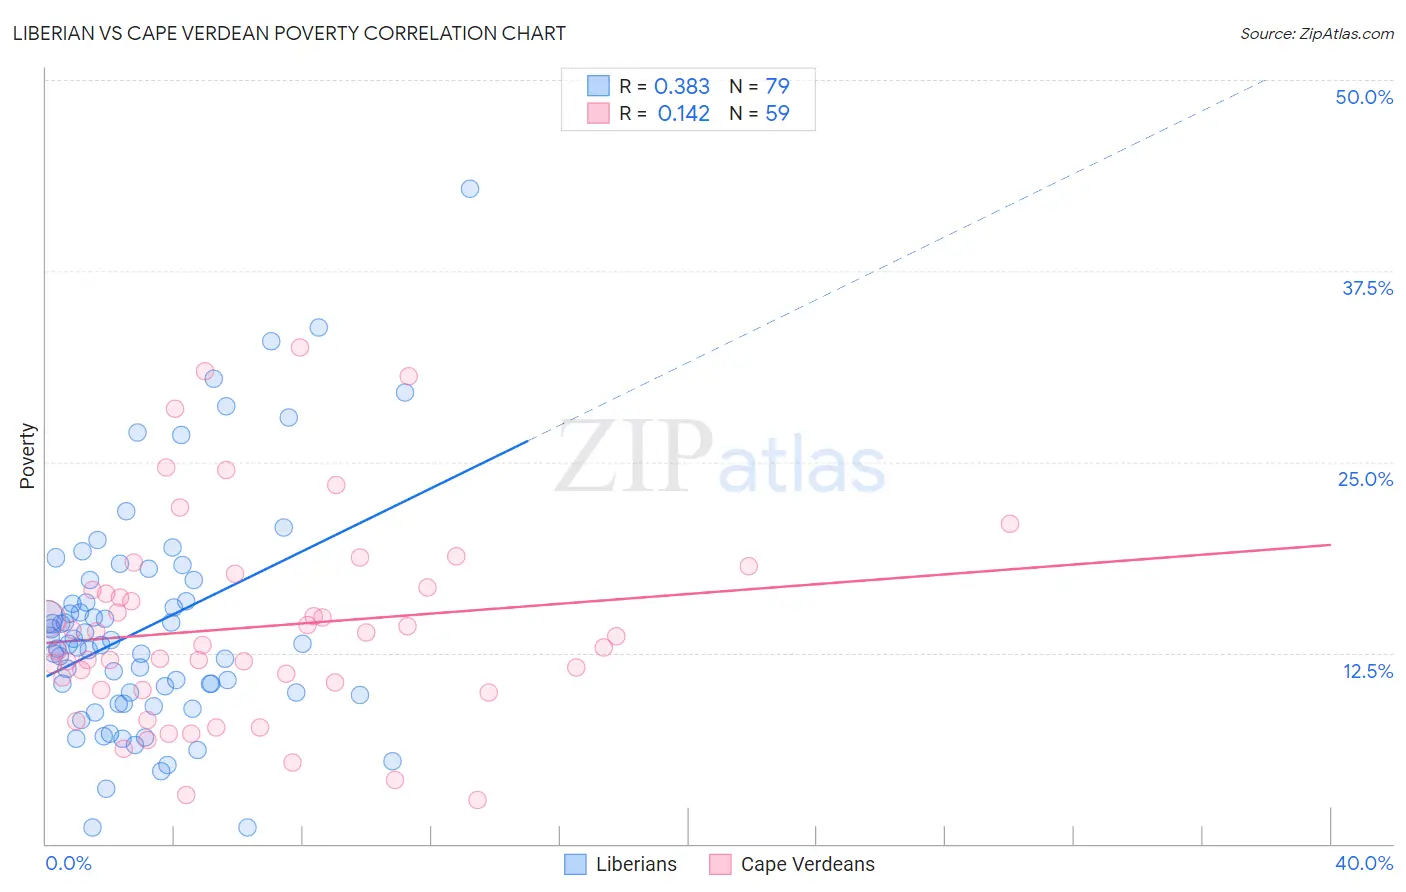
Liberian vs Cape Verdean Poverty Correlation Chart
The statistical analysis conducted on geographies consisting of 118,042,560 people shows a mild positive correlation between the proportion of Liberians and poverty level in the United States with a correlation coefficient (R) of 0.383 and weighted average of 14.1%. Similarly, the statistical analysis conducted on geographies consisting of 107,560,730 people shows a poor positive correlation between the proportion of Cape Verdeans and poverty level in the United States with a correlation coefficient (R) of 0.142 and weighted average of 14.4%, a difference of 1.5%.
Poverty Correlation Summary
| Measurement | Liberian | Cape Verdean |
| Minimum | 1.0% | 2.9% |
| Maximum | 42.9% | 32.5% |
| Range | 41.9% | 29.6% |
| Mean | 14.3% | 14.2% |
| Median | 13.1% | 13.0% |
| Interquartile 25% (IQ1) | 9.8% | 10.1% |
| Interquartile 75% (IQ3) | 17.3% | 16.7% |
| Interquartile Range (IQR) | 7.5% | 6.6% |
| Standard Deviation (Sample) | 7.6% | 6.6% |
| Standard Deviation (Population) | 7.6% | 6.6% |
Demographics Similar to Liberians and Cape Verdeans by Poverty
In terms of poverty, the demographic groups most similar to Liberians are Immigrants from Western Africa (14.1%, a difference of 0.020%), Immigrants from Ghana (14.2%, a difference of 0.11%), Potawatomi (14.1%, a difference of 0.28%), Cree (14.2%, a difference of 0.41%), and Immigrants from Sudan (14.1%, a difference of 0.48%). Similarly, the demographic groups most similar to Cape Verdeans are Cherokee (14.4%, a difference of 0.020%), Immigrants from Nicaragua (14.3%, a difference of 0.080%), Immigrants from Liberia (14.4%, a difference of 0.18%), Ottawa (14.3%, a difference of 0.35%), and Trinidadian and Tobagonian (14.3%, a difference of 0.36%).
| Demographics | Rating | Rank | Poverty |
| Sudanese | 0.3 /100 | #243 | Tragic 14.0% |
| Nepalese | 0.3 /100 | #244 | Tragic 14.0% |
| Immigrants | Sudan | 0.3 /100 | #245 | Tragic 14.1% |
| Potawatomi | 0.3 /100 | #246 | Tragic 14.1% |
| Liberians | 0.2 /100 | #247 | Tragic 14.1% |
| Immigrants | Western Africa | 0.2 /100 | #248 | Tragic 14.1% |
| Immigrants | Ghana | 0.2 /100 | #249 | Tragic 14.2% |
| Cree | 0.2 /100 | #250 | Tragic 14.2% |
| Immigrants | Burma/Myanmar | 0.2 /100 | #251 | Tragic 14.2% |
| Spanish American Indians | 0.2 /100 | #252 | Tragic 14.2% |
| Immigrants | Trinidad and Tobago | 0.2 /100 | #253 | Tragic 14.2% |
| Immigrants | El Salvador | 0.1 /100 | #254 | Tragic 14.3% |
| Immigrants | Ecuador | 0.1 /100 | #255 | Tragic 14.3% |
| Mexican American Indians | 0.1 /100 | #256 | Tragic 14.3% |
| Trinidadians and Tobagonians | 0.1 /100 | #257 | Tragic 14.3% |
| Ottawa | 0.1 /100 | #258 | Tragic 14.3% |
| Immigrants | Nicaragua | 0.1 /100 | #259 | Tragic 14.3% |
| Cape Verdeans | 0.1 /100 | #260 | Tragic 14.4% |
| Cherokee | 0.1 /100 | #261 | Tragic 14.4% |
| Immigrants | Liberia | 0.1 /100 | #262 | Tragic 14.4% |
| Jamaicans | 0.1 /100 | #263 | Tragic 14.4% |