Immigrants from Latin America vs Cape Verdean Poverty
COMPARE
Immigrants from Latin America
Cape Verdean
Poverty
Poverty Comparison
Immigrants from Latin America
Cape Verdeans
15.0%
POVERTY
0.0/ 100
METRIC RATING
286th/ 347
METRIC RANK
14.4%
POVERTY
0.1/ 100
METRIC RATING
260th/ 347
METRIC RANK
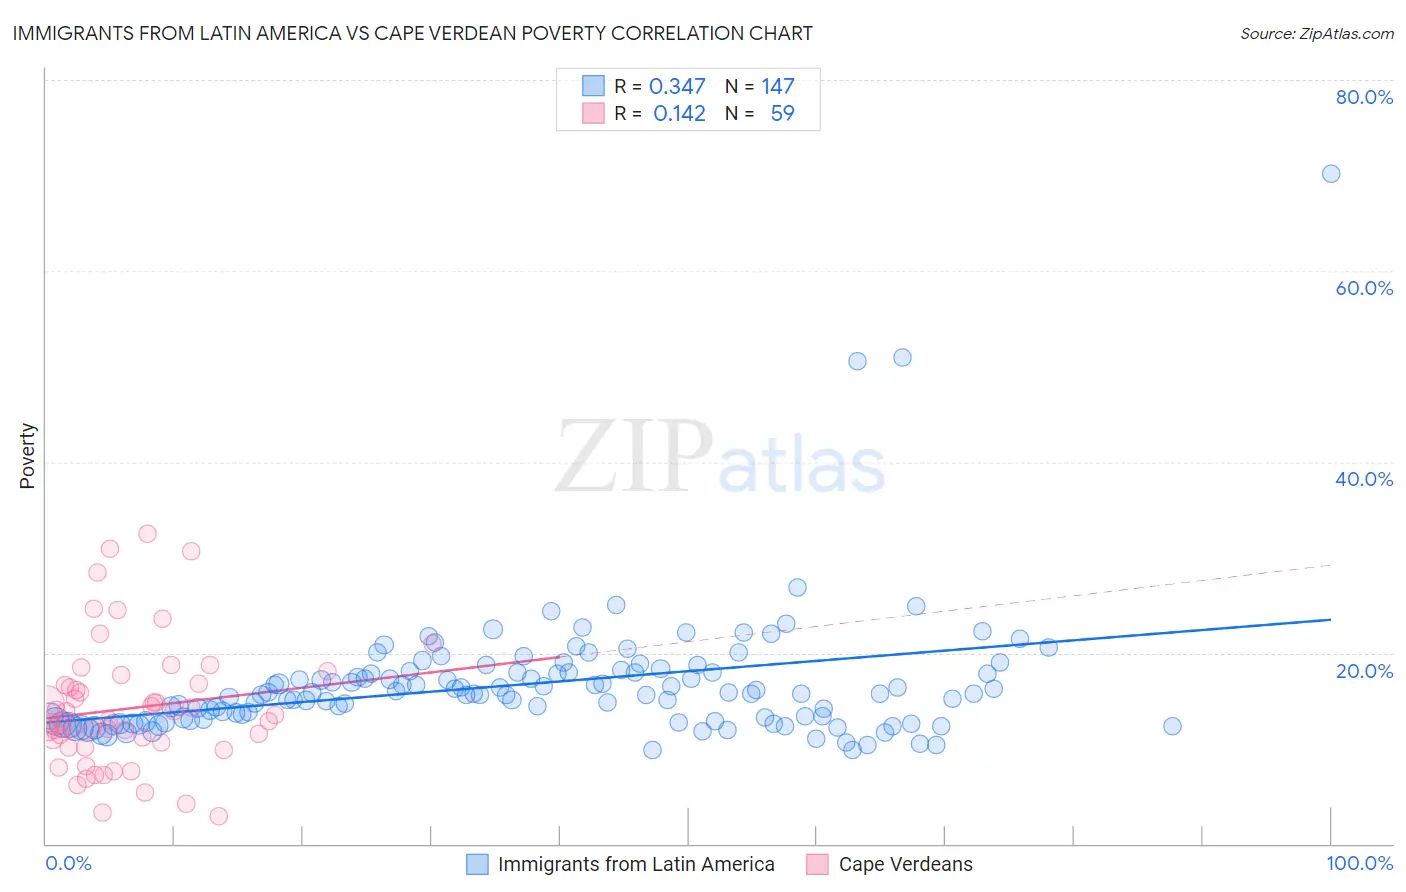
Immigrants from Latin America vs Cape Verdean Poverty Correlation Chart
The statistical analysis conducted on geographies consisting of 557,920,338 people shows a mild positive correlation between the proportion of Immigrants from Latin America and poverty level in the United States with a correlation coefficient (R) of 0.347 and weighted average of 15.0%. Similarly, the statistical analysis conducted on geographies consisting of 107,560,730 people shows a poor positive correlation between the proportion of Cape Verdeans and poverty level in the United States with a correlation coefficient (R) of 0.142 and weighted average of 14.4%, a difference of 4.8%.
Poverty Correlation Summary
| Measurement | Immigrants from Latin America | Cape Verdean |
| Minimum | 9.8% | 2.9% |
| Maximum | 70.2% | 32.5% |
| Range | 60.4% | 29.6% |
| Mean | 16.7% | 14.2% |
| Median | 15.7% | 13.0% |
| Interquartile 25% (IQ1) | 12.9% | 10.1% |
| Interquartile 75% (IQ3) | 17.9% | 16.7% |
| Interquartile Range (IQR) | 5.0% | 6.6% |
| Standard Deviation (Sample) | 6.9% | 6.6% |
| Standard Deviation (Population) | 6.9% | 6.6% |
Similar Demographics by Poverty
Demographics Similar to Immigrants from Latin America by Poverty
In terms of poverty, the demographic groups most similar to Immigrants from Latin America are Inupiat (15.1%, a difference of 0.21%), Yaqui (15.1%, a difference of 0.22%), Vietnamese (15.0%, a difference of 0.26%), West Indian (15.0%, a difference of 0.32%), and Immigrants from Belize (15.1%, a difference of 0.34%).
| Demographics | Rating | Rank | Poverty |
| Immigrants | St. Vincent and the Grenadines | 0.0 /100 | #279 | Tragic 14.9% |
| Haitians | 0.0 /100 | #280 | Tragic 14.9% |
| Immigrants | Barbados | 0.0 /100 | #281 | Tragic 14.9% |
| Comanche | 0.0 /100 | #282 | Tragic 15.0% |
| Immigrants | Haiti | 0.0 /100 | #283 | Tragic 15.0% |
| West Indians | 0.0 /100 | #284 | Tragic 15.0% |
| Vietnamese | 0.0 /100 | #285 | Tragic 15.0% |
| Immigrants | Latin America | 0.0 /100 | #286 | Tragic 15.0% |
| Inupiat | 0.0 /100 | #287 | Tragic 15.1% |
| Yaqui | 0.0 /100 | #288 | Tragic 15.1% |
| Immigrants | Belize | 0.0 /100 | #289 | Tragic 15.1% |
| Mexicans | 0.0 /100 | #290 | Tragic 15.1% |
| Immigrants | Cabo Verde | 0.0 /100 | #291 | Tragic 15.1% |
| Indonesians | 0.0 /100 | #292 | Tragic 15.1% |
| Immigrants | Zaire | 0.0 /100 | #293 | Tragic 15.1% |
Demographics Similar to Cape Verdeans by Poverty
In terms of poverty, the demographic groups most similar to Cape Verdeans are Cherokee (14.4%, a difference of 0.020%), Immigrants from Nicaragua (14.3%, a difference of 0.080%), Immigrants from Liberia (14.4%, a difference of 0.18%), Ottawa (14.3%, a difference of 0.35%), and Trinidadian and Tobagonian (14.3%, a difference of 0.36%).
| Demographics | Rating | Rank | Poverty |
| Immigrants | Trinidad and Tobago | 0.2 /100 | #253 | Tragic 14.2% |
| Immigrants | El Salvador | 0.1 /100 | #254 | Tragic 14.3% |
| Immigrants | Ecuador | 0.1 /100 | #255 | Tragic 14.3% |
| Mexican American Indians | 0.1 /100 | #256 | Tragic 14.3% |
| Trinidadians and Tobagonians | 0.1 /100 | #257 | Tragic 14.3% |
| Ottawa | 0.1 /100 | #258 | Tragic 14.3% |
| Immigrants | Nicaragua | 0.1 /100 | #259 | Tragic 14.3% |
| Cape Verdeans | 0.1 /100 | #260 | Tragic 14.4% |
| Cherokee | 0.1 /100 | #261 | Tragic 14.4% |
| Immigrants | Liberia | 0.1 /100 | #262 | Tragic 14.4% |
| Jamaicans | 0.1 /100 | #263 | Tragic 14.4% |
| Immigrants | Jamaica | 0.1 /100 | #264 | Tragic 14.4% |
| Immigrants | Guyana | 0.1 /100 | #265 | Tragic 14.5% |
| Guyanese | 0.1 /100 | #266 | Tragic 14.5% |
| Iroquois | 0.1 /100 | #267 | Tragic 14.5% |