Immigrants from Croatia vs Estonian Poverty
COMPARE
Immigrants from Croatia
Estonian
Poverty
Poverty Comparison
Immigrants from Croatia
Estonians
11.0%
POVERTY
98.7/ 100
METRIC RATING
51st/ 347
METRIC RANK
11.1%
POVERTY
98.2/ 100
METRIC RATING
56th/ 347
METRIC RANK
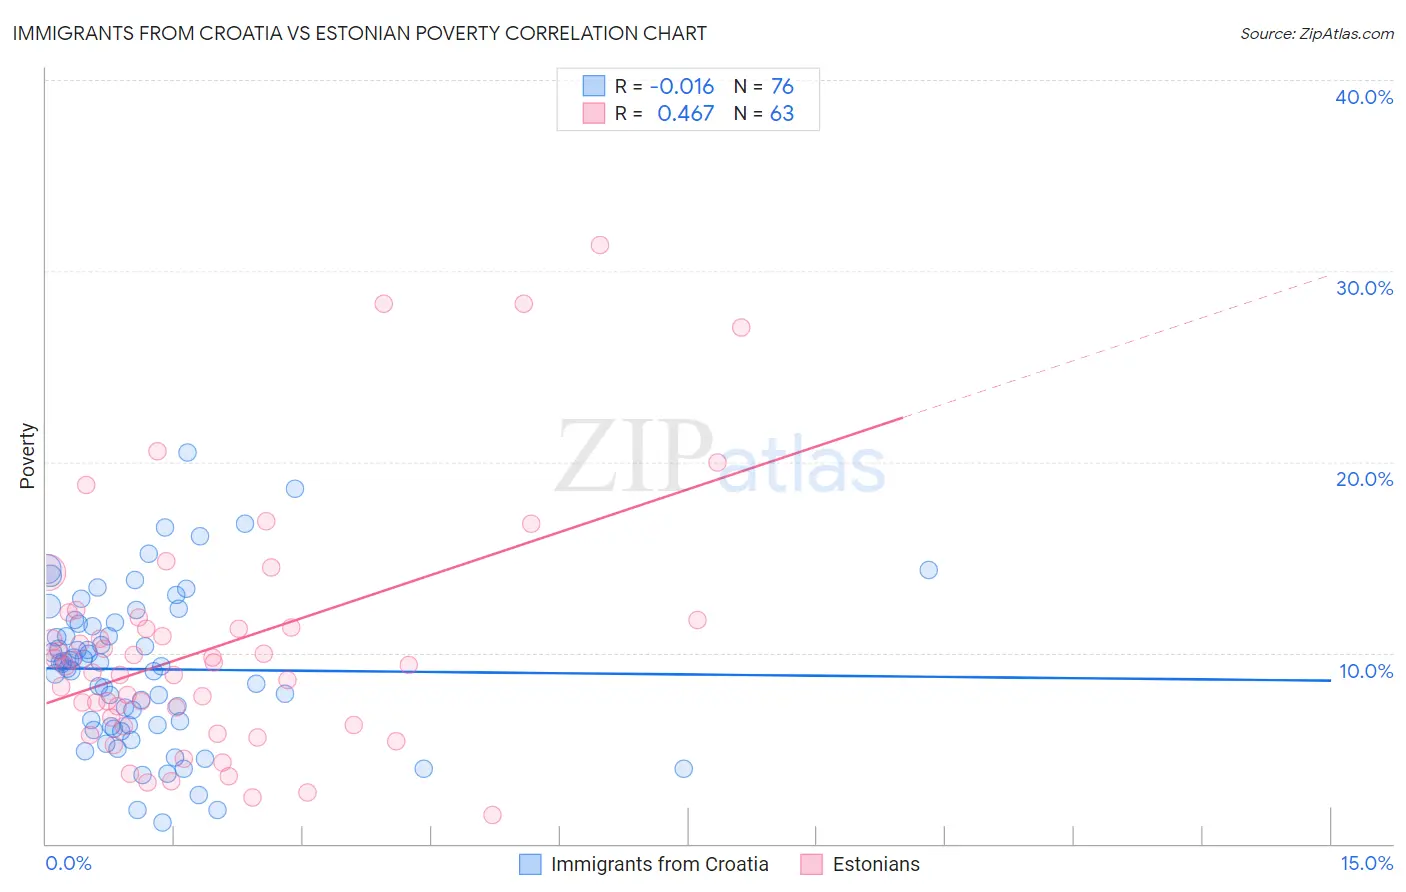
Immigrants from Croatia vs Estonian Poverty Correlation Chart
The statistical analysis conducted on geographies consisting of 132,563,903 people shows no correlation between the proportion of Immigrants from Croatia and poverty level in the United States with a correlation coefficient (R) of -0.016 and weighted average of 11.0%. Similarly, the statistical analysis conducted on geographies consisting of 123,503,598 people shows a moderate positive correlation between the proportion of Estonians and poverty level in the United States with a correlation coefficient (R) of 0.467 and weighted average of 11.1%, a difference of 0.87%.
Poverty Correlation Summary
| Measurement | Immigrants from Croatia | Estonian |
| Minimum | 1.1% | 1.5% |
| Maximum | 20.5% | 31.4% |
| Range | 19.4% | 29.8% |
| Mean | 9.1% | 10.3% |
| Median | 9.4% | 9.4% |
| Interquartile 25% (IQ1) | 6.2% | 6.2% |
| Interquartile 75% (IQ3) | 11.6% | 11.7% |
| Interquartile Range (IQR) | 5.4% | 5.5% |
| Standard Deviation (Sample) | 4.0% | 6.3% |
| Standard Deviation (Population) | 4.0% | 6.3% |
Demographics Similar to Immigrants from Croatia and Estonians by Poverty
In terms of poverty, the demographic groups most similar to Immigrants from Croatia are Immigrants from Philippines (11.0%, a difference of 0.020%), Immigrants from Austria (11.1%, a difference of 0.24%), Immigrants from Bulgaria (11.1%, a difference of 0.36%), Immigrants from Serbia (11.1%, a difference of 0.39%), and Asian (11.0%, a difference of 0.41%). Similarly, the demographic groups most similar to Estonians are Scandinavian (11.1%, a difference of 0.040%), German (11.1%, a difference of 0.10%), Immigrants from Europe (11.2%, a difference of 0.25%), Immigrants from Sri Lanka (11.2%, a difference of 0.42%), and Immigrants from Serbia (11.1%, a difference of 0.48%).
| Demographics | Rating | Rank | Poverty |
| Immigrants | Singapore | 99.2 /100 | #43 | Exceptional 10.9% |
| Immigrants | Moldova | 99.1 /100 | #44 | Exceptional 10.9% |
| Turks | 98.9 /100 | #45 | Exceptional 11.0% |
| Immigrants | Czechoslovakia | 98.9 /100 | #46 | Exceptional 11.0% |
| Immigrants | Romania | 98.9 /100 | #47 | Exceptional 11.0% |
| Slovenes | 98.9 /100 | #48 | Exceptional 11.0% |
| Immigrants | Japan | 98.9 /100 | #49 | Exceptional 11.0% |
| Asians | 98.9 /100 | #50 | Exceptional 11.0% |
| Immigrants | Croatia | 98.7 /100 | #51 | Exceptional 11.0% |
| Immigrants | Philippines | 98.7 /100 | #52 | Exceptional 11.0% |
| Immigrants | Austria | 98.6 /100 | #53 | Exceptional 11.1% |
| Immigrants | Bulgaria | 98.5 /100 | #54 | Exceptional 11.1% |
| Immigrants | Serbia | 98.5 /100 | #55 | Exceptional 11.1% |
| Estonians | 98.2 /100 | #56 | Exceptional 11.1% |
| Scandinavians | 98.2 /100 | #57 | Exceptional 11.1% |
| Germans | 98.1 /100 | #58 | Exceptional 11.1% |
| Immigrants | Europe | 98.0 /100 | #59 | Exceptional 11.2% |
| Immigrants | Sri Lanka | 97.9 /100 | #60 | Exceptional 11.2% |
| Immigrants | Italy | 97.9 /100 | #61 | Exceptional 11.2% |
| Austrians | 97.8 /100 | #62 | Exceptional 11.2% |
| Ukrainians | 97.8 /100 | #63 | Exceptional 11.2% |