Immigrants from Croatia vs Immigrants from Austria Poverty
COMPARE
Immigrants from Croatia
Immigrants from Austria
Poverty
Poverty Comparison
Immigrants from Croatia
Immigrants from Austria
11.0%
POVERTY
98.7/ 100
METRIC RATING
51st/ 347
METRIC RANK
11.1%
POVERTY
98.6/ 100
METRIC RATING
53rd/ 347
METRIC RANK
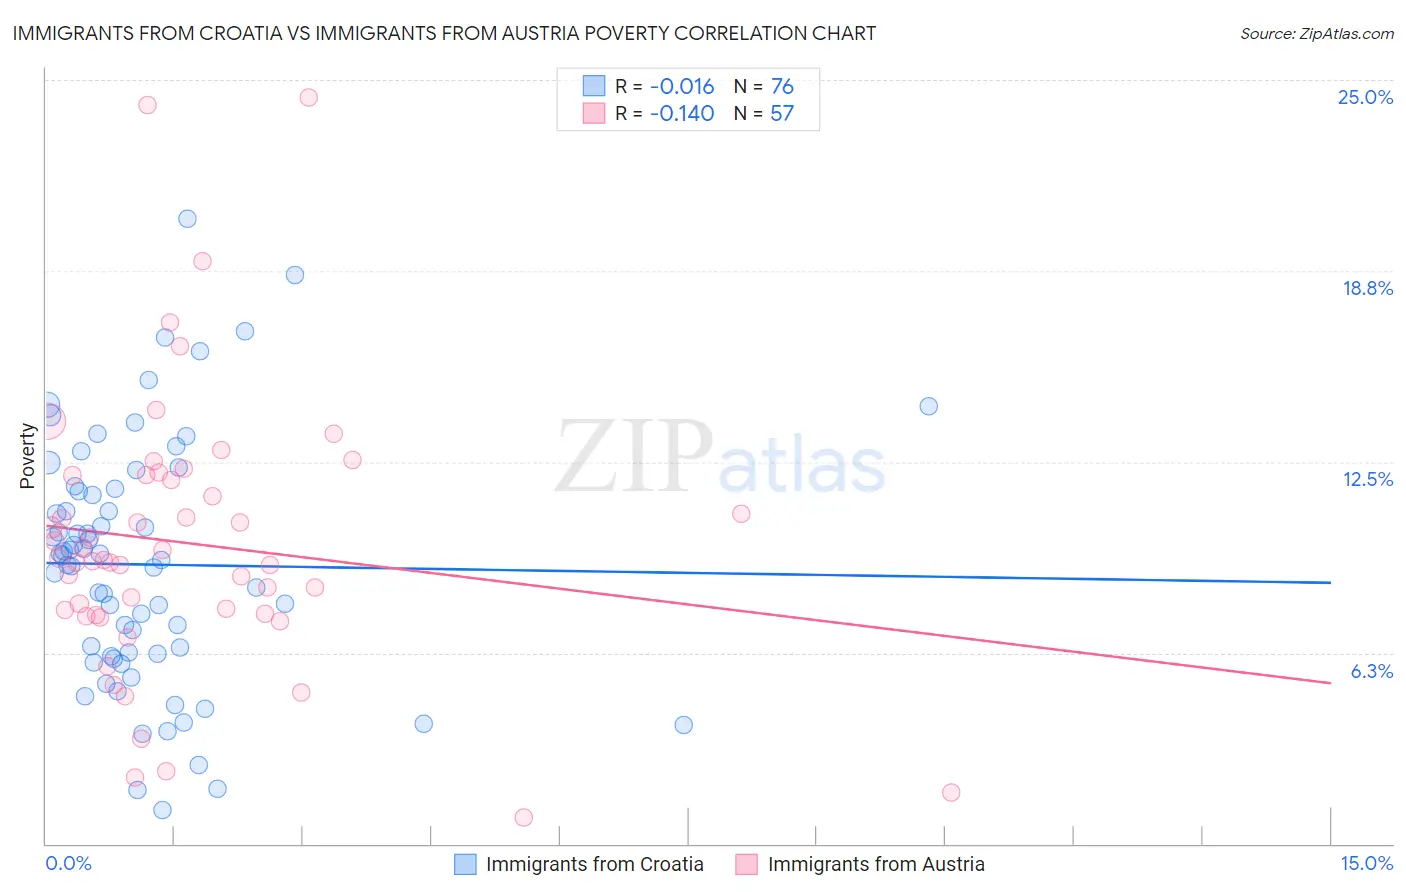
Immigrants from Croatia vs Immigrants from Austria Poverty Correlation Chart
The statistical analysis conducted on geographies consisting of 132,563,903 people shows no correlation between the proportion of Immigrants from Croatia and poverty level in the United States with a correlation coefficient (R) of -0.016 and weighted average of 11.0%. Similarly, the statistical analysis conducted on geographies consisting of 167,938,578 people shows a poor negative correlation between the proportion of Immigrants from Austria and poverty level in the United States with a correlation coefficient (R) of -0.140 and weighted average of 11.1%, a difference of 0.24%.
Poverty Correlation Summary
| Measurement | Immigrants from Croatia | Immigrants from Austria |
| Minimum | 1.1% | 0.88% |
| Maximum | 20.5% | 24.4% |
| Range | 19.4% | 23.6% |
| Mean | 9.1% | 9.8% |
| Median | 9.4% | 9.3% |
| Interquartile 25% (IQ1) | 6.2% | 7.5% |
| Interquartile 75% (IQ3) | 11.6% | 12.1% |
| Interquartile Range (IQR) | 5.4% | 4.5% |
| Standard Deviation (Sample) | 4.0% | 4.5% |
| Standard Deviation (Population) | 4.0% | 4.5% |
Demographics Similar to Immigrants from Croatia and Immigrants from Austria by Poverty
In terms of poverty, the demographic groups most similar to Immigrants from Croatia are Immigrants from Philippines (11.0%, a difference of 0.020%), Immigrants from Bulgaria (11.1%, a difference of 0.36%), Immigrants from Serbia (11.1%, a difference of 0.39%), Asian (11.0%, a difference of 0.41%), and Immigrants from Japan (11.0%, a difference of 0.44%). Similarly, the demographic groups most similar to Immigrants from Austria are Immigrants from Bulgaria (11.1%, a difference of 0.12%), Immigrants from Serbia (11.1%, a difference of 0.15%), Immigrants from Philippines (11.0%, a difference of 0.23%), Estonian (11.1%, a difference of 0.63%), and Asian (11.0%, a difference of 0.65%).
| Demographics | Rating | Rank | Poverty |
| Koreans | 99.2 /100 | #42 | Exceptional 10.9% |
| Immigrants | Singapore | 99.2 /100 | #43 | Exceptional 10.9% |
| Immigrants | Moldova | 99.1 /100 | #44 | Exceptional 10.9% |
| Turks | 98.9 /100 | #45 | Exceptional 11.0% |
| Immigrants | Czechoslovakia | 98.9 /100 | #46 | Exceptional 11.0% |
| Immigrants | Romania | 98.9 /100 | #47 | Exceptional 11.0% |
| Slovenes | 98.9 /100 | #48 | Exceptional 11.0% |
| Immigrants | Japan | 98.9 /100 | #49 | Exceptional 11.0% |
| Asians | 98.9 /100 | #50 | Exceptional 11.0% |
| Immigrants | Croatia | 98.7 /100 | #51 | Exceptional 11.0% |
| Immigrants | Philippines | 98.7 /100 | #52 | Exceptional 11.0% |
| Immigrants | Austria | 98.6 /100 | #53 | Exceptional 11.1% |
| Immigrants | Bulgaria | 98.5 /100 | #54 | Exceptional 11.1% |
| Immigrants | Serbia | 98.5 /100 | #55 | Exceptional 11.1% |
| Estonians | 98.2 /100 | #56 | Exceptional 11.1% |
| Scandinavians | 98.2 /100 | #57 | Exceptional 11.1% |
| Germans | 98.1 /100 | #58 | Exceptional 11.1% |
| Immigrants | Europe | 98.0 /100 | #59 | Exceptional 11.2% |
| Immigrants | Sri Lanka | 97.9 /100 | #60 | Exceptional 11.2% |
| Immigrants | Italy | 97.9 /100 | #61 | Exceptional 11.2% |
| Austrians | 97.8 /100 | #62 | Exceptional 11.2% |