Immigrants from Croatia vs Immigrants from Bangladesh Poverty
COMPARE
Immigrants from Croatia
Immigrants from Bangladesh
Poverty
Poverty Comparison
Immigrants from Croatia
Immigrants from Bangladesh
11.0%
POVERTY
98.7/ 100
METRIC RATING
51st/ 347
METRIC RANK
15.3%
POVERTY
0.0/ 100
METRIC RATING
297th/ 347
METRIC RANK
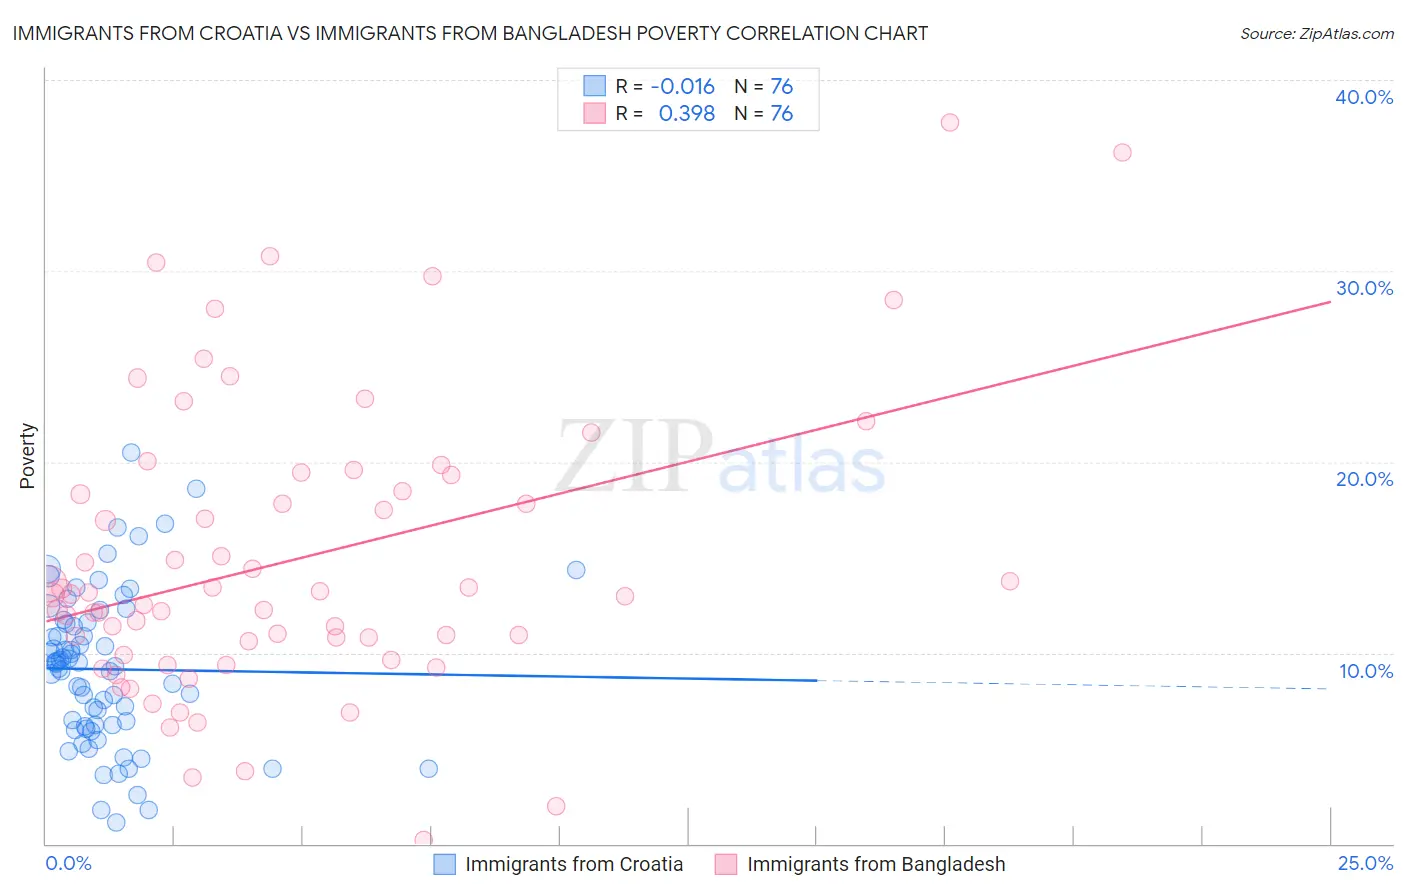
Immigrants from Croatia vs Immigrants from Bangladesh Poverty Correlation Chart
The statistical analysis conducted on geographies consisting of 132,563,903 people shows no correlation between the proportion of Immigrants from Croatia and poverty level in the United States with a correlation coefficient (R) of -0.016 and weighted average of 11.0%. Similarly, the statistical analysis conducted on geographies consisting of 203,580,134 people shows a mild positive correlation between the proportion of Immigrants from Bangladesh and poverty level in the United States with a correlation coefficient (R) of 0.398 and weighted average of 15.3%, a difference of 38.4%.
Poverty Correlation Summary
| Measurement | Immigrants from Croatia | Immigrants from Bangladesh |
| Minimum | 1.1% | 0.18% |
| Maximum | 20.5% | 37.7% |
| Range | 19.4% | 37.6% |
| Mean | 9.1% | 14.9% |
| Median | 9.4% | 13.1% |
| Interquartile 25% (IQ1) | 6.2% | 10.2% |
| Interquartile 75% (IQ3) | 11.6% | 18.9% |
| Interquartile Range (IQR) | 5.4% | 8.6% |
| Standard Deviation (Sample) | 4.0% | 7.6% |
| Standard Deviation (Population) | 4.0% | 7.5% |
Similar Demographics by Poverty
Demographics Similar to Immigrants from Croatia by Poverty
In terms of poverty, the demographic groups most similar to Immigrants from Croatia are Immigrants from Philippines (11.0%, a difference of 0.020%), Immigrants from Austria (11.1%, a difference of 0.24%), Immigrants from Bulgaria (11.1%, a difference of 0.36%), Immigrants from Serbia (11.1%, a difference of 0.39%), and Asian (11.0%, a difference of 0.41%).
| Demographics | Rating | Rank | Poverty |
| Immigrants | Moldova | 99.1 /100 | #44 | Exceptional 10.9% |
| Turks | 98.9 /100 | #45 | Exceptional 11.0% |
| Immigrants | Czechoslovakia | 98.9 /100 | #46 | Exceptional 11.0% |
| Immigrants | Romania | 98.9 /100 | #47 | Exceptional 11.0% |
| Slovenes | 98.9 /100 | #48 | Exceptional 11.0% |
| Immigrants | Japan | 98.9 /100 | #49 | Exceptional 11.0% |
| Asians | 98.9 /100 | #50 | Exceptional 11.0% |
| Immigrants | Croatia | 98.7 /100 | #51 | Exceptional 11.0% |
| Immigrants | Philippines | 98.7 /100 | #52 | Exceptional 11.0% |
| Immigrants | Austria | 98.6 /100 | #53 | Exceptional 11.1% |
| Immigrants | Bulgaria | 98.5 /100 | #54 | Exceptional 11.1% |
| Immigrants | Serbia | 98.5 /100 | #55 | Exceptional 11.1% |
| Estonians | 98.2 /100 | #56 | Exceptional 11.1% |
| Scandinavians | 98.2 /100 | #57 | Exceptional 11.1% |
| Germans | 98.1 /100 | #58 | Exceptional 11.1% |
Demographics Similar to Immigrants from Bangladesh by Poverty
In terms of poverty, the demographic groups most similar to Immigrants from Bangladesh are Guatemalan (15.3%, a difference of 0.050%), Hispanic or Latino (15.3%, a difference of 0.050%), Immigrants from Senegal (15.3%, a difference of 0.15%), Senegalese (15.3%, a difference of 0.24%), and Blackfeet (15.2%, a difference of 0.47%).
| Demographics | Rating | Rank | Poverty |
| Mexicans | 0.0 /100 | #290 | Tragic 15.1% |
| Immigrants | Cabo Verde | 0.0 /100 | #291 | Tragic 15.1% |
| Indonesians | 0.0 /100 | #292 | Tragic 15.1% |
| Immigrants | Zaire | 0.0 /100 | #293 | Tragic 15.1% |
| Blackfeet | 0.0 /100 | #294 | Tragic 15.2% |
| Guatemalans | 0.0 /100 | #295 | Tragic 15.3% |
| Hispanics or Latinos | 0.0 /100 | #296 | Tragic 15.3% |
| Immigrants | Bangladesh | 0.0 /100 | #297 | Tragic 15.3% |
| Immigrants | Senegal | 0.0 /100 | #298 | Tragic 15.3% |
| Senegalese | 0.0 /100 | #299 | Tragic 15.3% |
| Immigrants | Central America | 0.0 /100 | #300 | Tragic 15.4% |
| Bahamians | 0.0 /100 | #301 | Tragic 15.4% |
| Somalis | 0.0 /100 | #302 | Tragic 15.4% |
| Immigrants | Caribbean | 0.0 /100 | #303 | Tragic 15.5% |
| Immigrants | Mexico | 0.0 /100 | #304 | Tragic 15.5% |