Immigrants from Central America vs Crow Single Female Poverty
COMPARE
Immigrants from Central America
Crow
Single Female Poverty
Single Female Poverty Comparison
Immigrants from Central America
Crow
24.8%
SINGLE FEMALE POVERTY
0.0/ 100
METRIC RATING
297th/ 347
METRIC RANK
32.4%
SINGLE FEMALE POVERTY
0.0/ 100
METRIC RATING
343rd/ 347
METRIC RANK
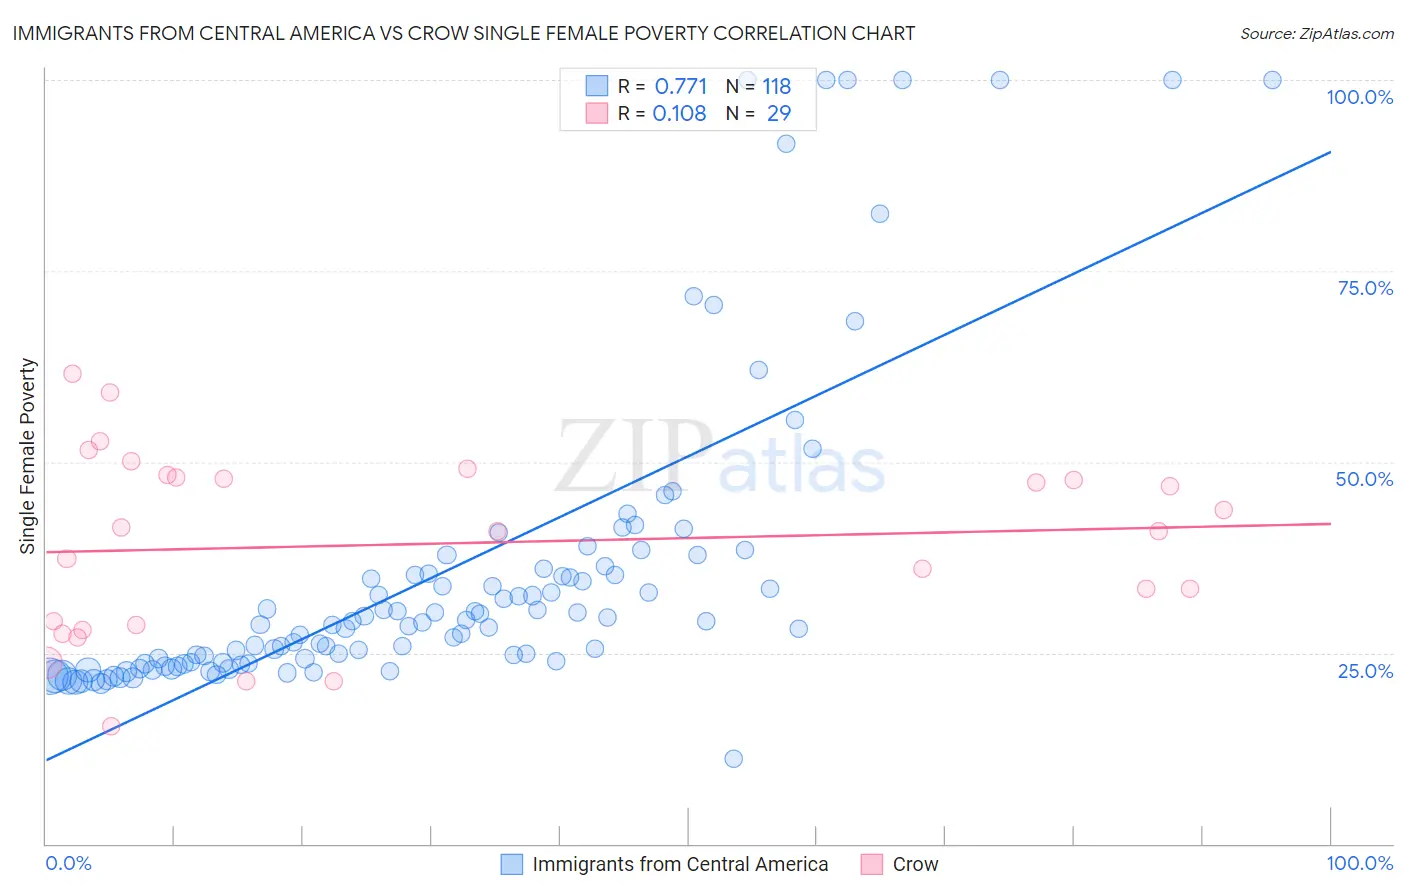
Immigrants from Central America vs Crow Single Female Poverty Correlation Chart
The statistical analysis conducted on geographies consisting of 523,015,170 people shows a strong positive correlation between the proportion of Immigrants from Central America and poverty level among single females in the United States with a correlation coefficient (R) of 0.771 and weighted average of 24.8%. Similarly, the statistical analysis conducted on geographies consisting of 58,998,568 people shows a poor positive correlation between the proportion of Crow and poverty level among single females in the United States with a correlation coefficient (R) of 0.108 and weighted average of 32.4%, a difference of 30.6%.
Single Female Poverty Correlation Summary
| Measurement | Immigrants from Central America | Crow |
| Minimum | 11.1% | 15.4% |
| Maximum | 100.0% | 61.5% |
| Range | 88.9% | 46.1% |
| Mean | 35.5% | 39.3% |
| Median | 28.8% | 40.9% |
| Interquartile 25% (IQ1) | 23.6% | 28.3% |
| Interquartile 75% (IQ3) | 35.4% | 48.1% |
| Interquartile Range (IQR) | 11.8% | 19.8% |
| Standard Deviation (Sample) | 20.4% | 12.0% |
| Standard Deviation (Population) | 20.3% | 11.8% |
Similar Demographics by Single Female Poverty
Demographics Similar to Immigrants from Central America by Single Female Poverty
In terms of single female poverty, the demographic groups most similar to Immigrants from Central America are Yaqui (24.9%, a difference of 0.19%), African (24.8%, a difference of 0.28%), Hispanic or Latino (24.6%, a difference of 0.76%), Mexican (25.0%, a difference of 0.86%), and Blackfeet (25.1%, a difference of 0.94%).
| Demographics | Rating | Rank | Single Female Poverty |
| Indonesians | 0.0 /100 | #290 | Tragic 24.3% |
| Osage | 0.0 /100 | #291 | Tragic 24.4% |
| Alsatians | 0.0 /100 | #292 | Tragic 24.5% |
| Americans | 0.0 /100 | #293 | Tragic 24.5% |
| French American Indians | 0.0 /100 | #294 | Tragic 24.6% |
| Hispanics or Latinos | 0.0 /100 | #295 | Tragic 24.6% |
| Africans | 0.0 /100 | #296 | Tragic 24.8% |
| Immigrants | Central America | 0.0 /100 | #297 | Tragic 24.8% |
| Yaqui | 0.0 /100 | #298 | Tragic 24.9% |
| Mexicans | 0.0 /100 | #299 | Tragic 25.0% |
| Blackfeet | 0.0 /100 | #300 | Tragic 25.1% |
| Hondurans | 0.0 /100 | #301 | Tragic 25.1% |
| Shoshone | 0.0 /100 | #302 | Tragic 25.1% |
| Somalis | 0.0 /100 | #303 | Tragic 25.2% |
| Immigrants | Congo | 0.0 /100 | #304 | Tragic 25.3% |
Demographics Similar to Crow by Single Female Poverty
In terms of single female poverty, the demographic groups most similar to Crow are Lumbee (33.0%, a difference of 1.8%), Navajo (31.7%, a difference of 2.4%), Sioux (31.3%, a difference of 3.7%), Houma (33.8%, a difference of 4.3%), and Puerto Rican (34.1%, a difference of 5.2%).
| Demographics | Rating | Rank | Single Female Poverty |
| Ute | 0.0 /100 | #333 | Tragic 28.4% |
| Pueblo | 0.0 /100 | #334 | Tragic 28.6% |
| Immigrants | Yemen | 0.0 /100 | #335 | Tragic 28.9% |
| Colville | 0.0 /100 | #336 | Tragic 29.1% |
| Yuman | 0.0 /100 | #337 | Tragic 29.4% |
| Pima | 0.0 /100 | #338 | Tragic 30.3% |
| Cheyenne | 0.0 /100 | #339 | Tragic 30.4% |
| Cajuns | 0.0 /100 | #340 | Tragic 30.6% |
| Sioux | 0.0 /100 | #341 | Tragic 31.3% |
| Navajo | 0.0 /100 | #342 | Tragic 31.7% |
| Crow | 0.0 /100 | #343 | Tragic 32.4% |
| Lumbee | 0.0 /100 | #344 | Tragic 33.0% |
| Houma | 0.0 /100 | #345 | Tragic 33.8% |
| Puerto Ricans | 0.0 /100 | #346 | Tragic 34.1% |
| Tohono O'odham | 0.0 /100 | #347 | Tragic 34.2% |