Immigrants from Central America vs Immigrants from Romania Single Female Poverty
COMPARE
Immigrants from Central America
Immigrants from Romania
Single Female Poverty
Single Female Poverty Comparison
Immigrants from Central America
Immigrants from Romania
24.8%
SINGLE FEMALE POVERTY
0.0/ 100
METRIC RATING
297th/ 347
METRIC RANK
18.8%
SINGLE FEMALE POVERTY
99.9/ 100
METRIC RATING
43rd/ 347
METRIC RANK
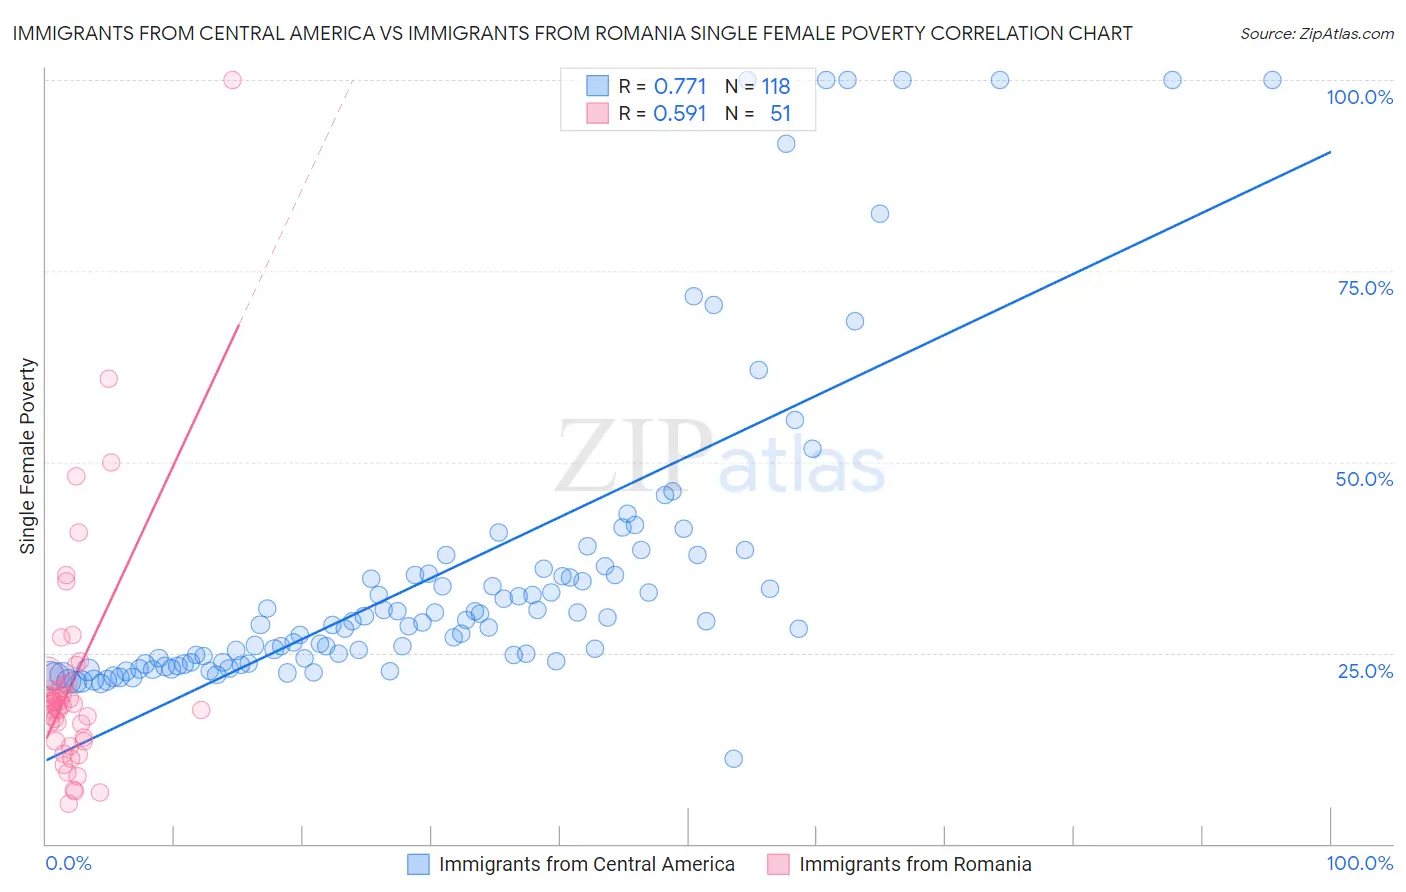
Immigrants from Central America vs Immigrants from Romania Single Female Poverty Correlation Chart
The statistical analysis conducted on geographies consisting of 523,015,170 people shows a strong positive correlation between the proportion of Immigrants from Central America and poverty level among single females in the United States with a correlation coefficient (R) of 0.771 and weighted average of 24.8%. Similarly, the statistical analysis conducted on geographies consisting of 254,376,234 people shows a substantial positive correlation between the proportion of Immigrants from Romania and poverty level among single females in the United States with a correlation coefficient (R) of 0.591 and weighted average of 18.8%, a difference of 31.7%.
Single Female Poverty Correlation Summary
| Measurement | Immigrants from Central America | Immigrants from Romania |
| Minimum | 11.1% | 5.2% |
| Maximum | 100.0% | 100.0% |
| Range | 88.9% | 94.8% |
| Mean | 35.5% | 21.4% |
| Median | 28.8% | 18.3% |
| Interquartile 25% (IQ1) | 23.6% | 13.5% |
| Interquartile 75% (IQ3) | 35.4% | 21.2% |
| Interquartile Range (IQR) | 11.8% | 7.7% |
| Standard Deviation (Sample) | 20.4% | 15.7% |
| Standard Deviation (Population) | 20.3% | 15.5% |
Similar Demographics by Single Female Poverty
Demographics Similar to Immigrants from Central America by Single Female Poverty
In terms of single female poverty, the demographic groups most similar to Immigrants from Central America are Yaqui (24.9%, a difference of 0.19%), African (24.8%, a difference of 0.28%), Hispanic or Latino (24.6%, a difference of 0.76%), Mexican (25.0%, a difference of 0.86%), and Blackfeet (25.1%, a difference of 0.94%).
| Demographics | Rating | Rank | Single Female Poverty |
| Indonesians | 0.0 /100 | #290 | Tragic 24.3% |
| Osage | 0.0 /100 | #291 | Tragic 24.4% |
| Alsatians | 0.0 /100 | #292 | Tragic 24.5% |
| Americans | 0.0 /100 | #293 | Tragic 24.5% |
| French American Indians | 0.0 /100 | #294 | Tragic 24.6% |
| Hispanics or Latinos | 0.0 /100 | #295 | Tragic 24.6% |
| Africans | 0.0 /100 | #296 | Tragic 24.8% |
| Immigrants | Central America | 0.0 /100 | #297 | Tragic 24.8% |
| Yaqui | 0.0 /100 | #298 | Tragic 24.9% |
| Mexicans | 0.0 /100 | #299 | Tragic 25.0% |
| Blackfeet | 0.0 /100 | #300 | Tragic 25.1% |
| Hondurans | 0.0 /100 | #301 | Tragic 25.1% |
| Shoshone | 0.0 /100 | #302 | Tragic 25.1% |
| Somalis | 0.0 /100 | #303 | Tragic 25.2% |
| Immigrants | Congo | 0.0 /100 | #304 | Tragic 25.3% |
Demographics Similar to Immigrants from Romania by Single Female Poverty
In terms of single female poverty, the demographic groups most similar to Immigrants from Romania are Jordanian (18.8%, a difference of 0.15%), Immigrants from Croatia (18.9%, a difference of 0.17%), Immigrants from Serbia (18.8%, a difference of 0.23%), Okinawan (18.8%, a difference of 0.25%), and Bulgarian (18.8%, a difference of 0.28%).
| Demographics | Rating | Rank | Single Female Poverty |
| Turks | 99.9 /100 | #36 | Exceptional 18.7% |
| Immigrants | Armenia | 99.9 /100 | #37 | Exceptional 18.7% |
| Tongans | 99.9 /100 | #38 | Exceptional 18.8% |
| Bulgarians | 99.9 /100 | #39 | Exceptional 18.8% |
| Okinawans | 99.9 /100 | #40 | Exceptional 18.8% |
| Immigrants | Serbia | 99.9 /100 | #41 | Exceptional 18.8% |
| Jordanians | 99.9 /100 | #42 | Exceptional 18.8% |
| Immigrants | Romania | 99.9 /100 | #43 | Exceptional 18.8% |
| Immigrants | Croatia | 99.9 /100 | #44 | Exceptional 18.9% |
| Immigrants | Indonesia | 99.8 /100 | #45 | Exceptional 18.9% |
| Macedonians | 99.8 /100 | #46 | Exceptional 18.9% |
| Latvians | 99.8 /100 | #47 | Exceptional 19.0% |
| Immigrants | Argentina | 99.8 /100 | #48 | Exceptional 19.0% |
| Immigrants | Czechoslovakia | 99.8 /100 | #49 | Exceptional 19.0% |
| Immigrants | Eastern Europe | 99.8 /100 | #50 | Exceptional 19.0% |