Immigrants from Central America vs Immigrants from Latvia Single Female Poverty
COMPARE
Immigrants from Central America
Immigrants from Latvia
Single Female Poverty
Single Female Poverty Comparison
Immigrants from Central America
Immigrants from Latvia
24.8%
SINGLE FEMALE POVERTY
0.0/ 100
METRIC RATING
297th/ 347
METRIC RANK
19.3%
SINGLE FEMALE POVERTY
99.4/ 100
METRIC RATING
72nd/ 347
METRIC RANK
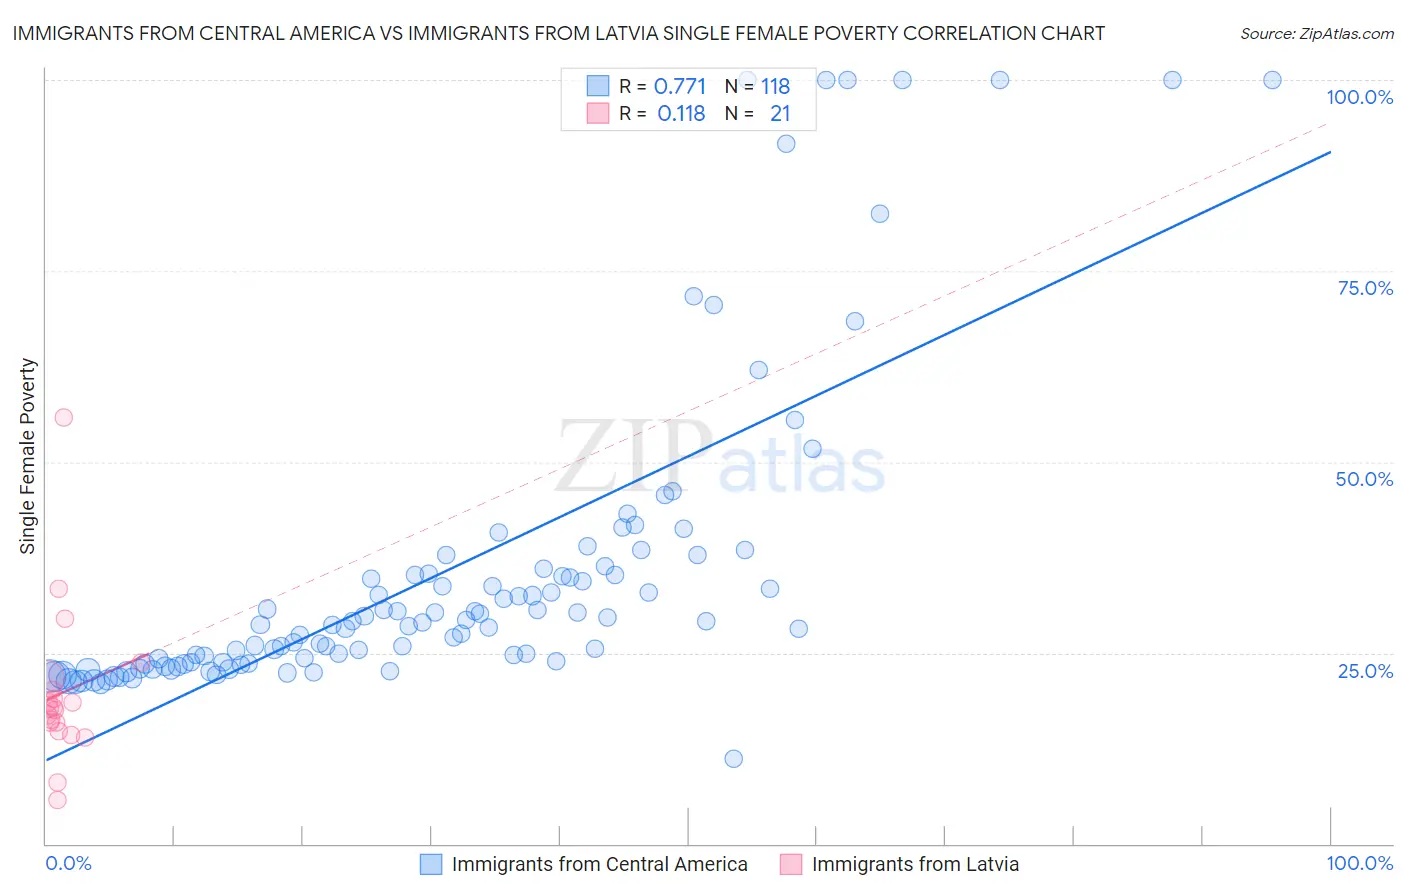
Immigrants from Central America vs Immigrants from Latvia Single Female Poverty Correlation Chart
The statistical analysis conducted on geographies consisting of 523,015,170 people shows a strong positive correlation between the proportion of Immigrants from Central America and poverty level among single females in the United States with a correlation coefficient (R) of 0.771 and weighted average of 24.8%. Similarly, the statistical analysis conducted on geographies consisting of 112,952,917 people shows a poor positive correlation between the proportion of Immigrants from Latvia and poverty level among single females in the United States with a correlation coefficient (R) of 0.118 and weighted average of 19.3%, a difference of 28.5%.
Single Female Poverty Correlation Summary
| Measurement | Immigrants from Central America | Immigrants from Latvia |
| Minimum | 11.1% | 5.7% |
| Maximum | 100.0% | 55.9% |
| Range | 88.9% | 50.1% |
| Mean | 35.5% | 19.7% |
| Median | 28.8% | 17.6% |
| Interquartile 25% (IQ1) | 23.6% | 15.3% |
| Interquartile 75% (IQ3) | 35.4% | 20.9% |
| Interquartile Range (IQR) | 11.8% | 5.6% |
| Standard Deviation (Sample) | 20.4% | 10.2% |
| Standard Deviation (Population) | 20.3% | 10.0% |
Similar Demographics by Single Female Poverty
Demographics Similar to Immigrants from Central America by Single Female Poverty
In terms of single female poverty, the demographic groups most similar to Immigrants from Central America are Yaqui (24.9%, a difference of 0.19%), African (24.8%, a difference of 0.28%), Hispanic or Latino (24.6%, a difference of 0.76%), Mexican (25.0%, a difference of 0.86%), and Blackfeet (25.1%, a difference of 0.94%).
| Demographics | Rating | Rank | Single Female Poverty |
| Indonesians | 0.0 /100 | #290 | Tragic 24.3% |
| Osage | 0.0 /100 | #291 | Tragic 24.4% |
| Alsatians | 0.0 /100 | #292 | Tragic 24.5% |
| Americans | 0.0 /100 | #293 | Tragic 24.5% |
| French American Indians | 0.0 /100 | #294 | Tragic 24.6% |
| Hispanics or Latinos | 0.0 /100 | #295 | Tragic 24.6% |
| Africans | 0.0 /100 | #296 | Tragic 24.8% |
| Immigrants | Central America | 0.0 /100 | #297 | Tragic 24.8% |
| Yaqui | 0.0 /100 | #298 | Tragic 24.9% |
| Mexicans | 0.0 /100 | #299 | Tragic 25.0% |
| Blackfeet | 0.0 /100 | #300 | Tragic 25.1% |
| Hondurans | 0.0 /100 | #301 | Tragic 25.1% |
| Shoshone | 0.0 /100 | #302 | Tragic 25.1% |
| Somalis | 0.0 /100 | #303 | Tragic 25.2% |
| Immigrants | Congo | 0.0 /100 | #304 | Tragic 25.3% |
Demographics Similar to Immigrants from Latvia by Single Female Poverty
In terms of single female poverty, the demographic groups most similar to Immigrants from Latvia are Immigrants from South Eastern Asia (19.3%, a difference of 0.0%), Immigrants from Jordan (19.3%, a difference of 0.070%), Immigrants from Peru (19.3%, a difference of 0.10%), Immigrants from Belarus (19.3%, a difference of 0.11%), and Paraguayan (19.3%, a difference of 0.14%).
| Demographics | Rating | Rank | Single Female Poverty |
| Cypriots | 99.6 /100 | #65 | Exceptional 19.2% |
| Palestinians | 99.6 /100 | #66 | Exceptional 19.2% |
| Immigrants | Egypt | 99.6 /100 | #67 | Exceptional 19.2% |
| Laotians | 99.5 /100 | #68 | Exceptional 19.3% |
| Paraguayans | 99.5 /100 | #69 | Exceptional 19.3% |
| Immigrants | Jordan | 99.4 /100 | #70 | Exceptional 19.3% |
| Immigrants | South Eastern Asia | 99.4 /100 | #71 | Exceptional 19.3% |
| Immigrants | Latvia | 99.4 /100 | #72 | Exceptional 19.3% |
| Immigrants | Peru | 99.4 /100 | #73 | Exceptional 19.3% |
| Immigrants | Belarus | 99.4 /100 | #74 | Exceptional 19.3% |
| Immigrants | Turkey | 99.4 /100 | #75 | Exceptional 19.4% |
| Peruvians | 99.4 /100 | #76 | Exceptional 19.4% |
| Immigrants | Russia | 99.3 /100 | #77 | Exceptional 19.4% |
| Albanians | 99.3 /100 | #78 | Exceptional 19.4% |
| Immigrants | Sierra Leone | 99.3 /100 | #79 | Exceptional 19.4% |