French vs Crow Single Female Poverty
COMPARE
French
Crow
Single Female Poverty
Single Female Poverty Comparison
French
Crow
22.2%
SINGLE FEMALE POVERTY
2.3/ 100
METRIC RATING
240th/ 347
METRIC RANK
32.4%
SINGLE FEMALE POVERTY
0.0/ 100
METRIC RATING
343rd/ 347
METRIC RANK
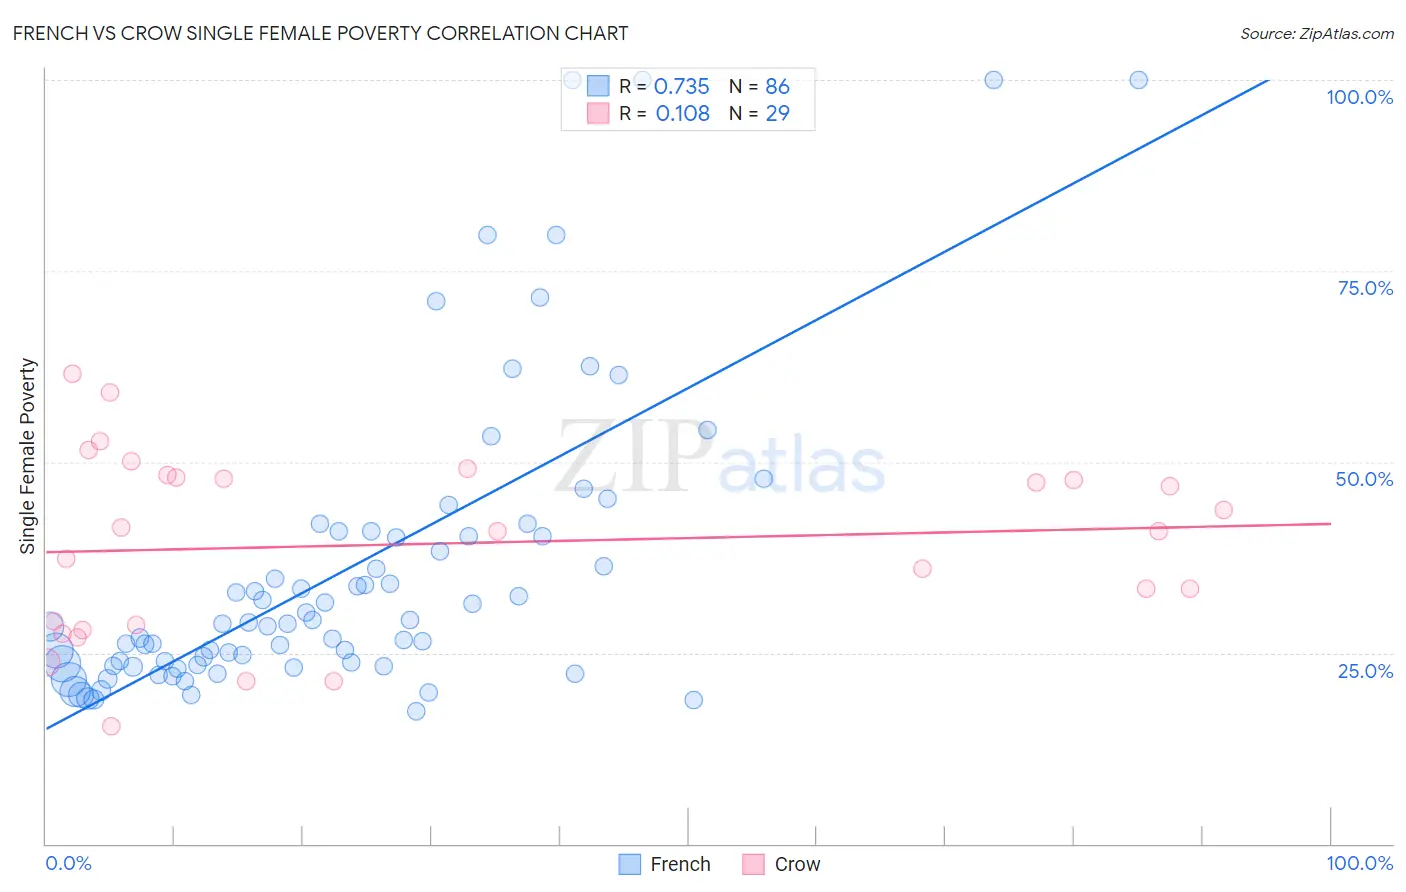
French vs Crow Single Female Poverty Correlation Chart
The statistical analysis conducted on geographies consisting of 551,878,026 people shows a strong positive correlation between the proportion of French and poverty level among single females in the United States with a correlation coefficient (R) of 0.735 and weighted average of 22.2%. Similarly, the statistical analysis conducted on geographies consisting of 58,998,568 people shows a poor positive correlation between the proportion of Crow and poverty level among single females in the United States with a correlation coefficient (R) of 0.108 and weighted average of 32.4%, a difference of 45.8%.
Single Female Poverty Correlation Summary
| Measurement | French | Crow |
| Minimum | 17.3% | 15.4% |
| Maximum | 100.0% | 61.5% |
| Range | 82.7% | 46.1% |
| Mean | 36.0% | 39.3% |
| Median | 28.8% | 40.9% |
| Interquartile 25% (IQ1) | 23.4% | 28.3% |
| Interquartile 75% (IQ3) | 40.3% | 48.1% |
| Interquartile Range (IQR) | 17.0% | 19.8% |
| Standard Deviation (Sample) | 19.8% | 12.0% |
| Standard Deviation (Population) | 19.7% | 11.8% |
Similar Demographics by Single Female Poverty
Demographics Similar to French by Single Female Poverty
In terms of single female poverty, the demographic groups most similar to French are Cape Verdean (22.3%, a difference of 0.14%), Bermudan (22.3%, a difference of 0.21%), Malaysian (22.2%, a difference of 0.26%), French Canadian (22.2%, a difference of 0.27%), and West Indian (22.3%, a difference of 0.30%).
| Demographics | Rating | Rank | Single Female Poverty |
| Spaniards | 4.7 /100 | #233 | Tragic 22.0% |
| Spanish | 4.7 /100 | #234 | Tragic 22.0% |
| Dutch | 4.6 /100 | #235 | Tragic 22.0% |
| Immigrants | Ecuador | 4.2 /100 | #236 | Tragic 22.0% |
| Vietnamese | 4.0 /100 | #237 | Tragic 22.0% |
| French Canadians | 2.8 /100 | #238 | Tragic 22.2% |
| Malaysians | 2.8 /100 | #239 | Tragic 22.2% |
| French | 2.3 /100 | #240 | Tragic 22.2% |
| Cape Verdeans | 2.1 /100 | #241 | Tragic 22.3% |
| Bermudans | 2.0 /100 | #242 | Tragic 22.3% |
| West Indians | 1.9 /100 | #243 | Tragic 22.3% |
| Immigrants | Middle Africa | 1.9 /100 | #244 | Tragic 22.3% |
| Immigrants | Bangladesh | 1.8 /100 | #245 | Tragic 22.3% |
| Liberians | 1.4 /100 | #246 | Tragic 22.4% |
| Immigrants | El Salvador | 1.4 /100 | #247 | Tragic 22.4% |
Demographics Similar to Crow by Single Female Poverty
In terms of single female poverty, the demographic groups most similar to Crow are Lumbee (33.0%, a difference of 1.8%), Navajo (31.7%, a difference of 2.4%), Sioux (31.3%, a difference of 3.7%), Houma (33.8%, a difference of 4.3%), and Puerto Rican (34.1%, a difference of 5.2%).
| Demographics | Rating | Rank | Single Female Poverty |
| Ute | 0.0 /100 | #333 | Tragic 28.4% |
| Pueblo | 0.0 /100 | #334 | Tragic 28.6% |
| Immigrants | Yemen | 0.0 /100 | #335 | Tragic 28.9% |
| Colville | 0.0 /100 | #336 | Tragic 29.1% |
| Yuman | 0.0 /100 | #337 | Tragic 29.4% |
| Pima | 0.0 /100 | #338 | Tragic 30.3% |
| Cheyenne | 0.0 /100 | #339 | Tragic 30.4% |
| Cajuns | 0.0 /100 | #340 | Tragic 30.6% |
| Sioux | 0.0 /100 | #341 | Tragic 31.3% |
| Navajo | 0.0 /100 | #342 | Tragic 31.7% |
| Crow | 0.0 /100 | #343 | Tragic 32.4% |
| Lumbee | 0.0 /100 | #344 | Tragic 33.0% |
| Houma | 0.0 /100 | #345 | Tragic 33.8% |
| Puerto Ricans | 0.0 /100 | #346 | Tragic 34.1% |
| Tohono O'odham | 0.0 /100 | #347 | Tragic 34.2% |